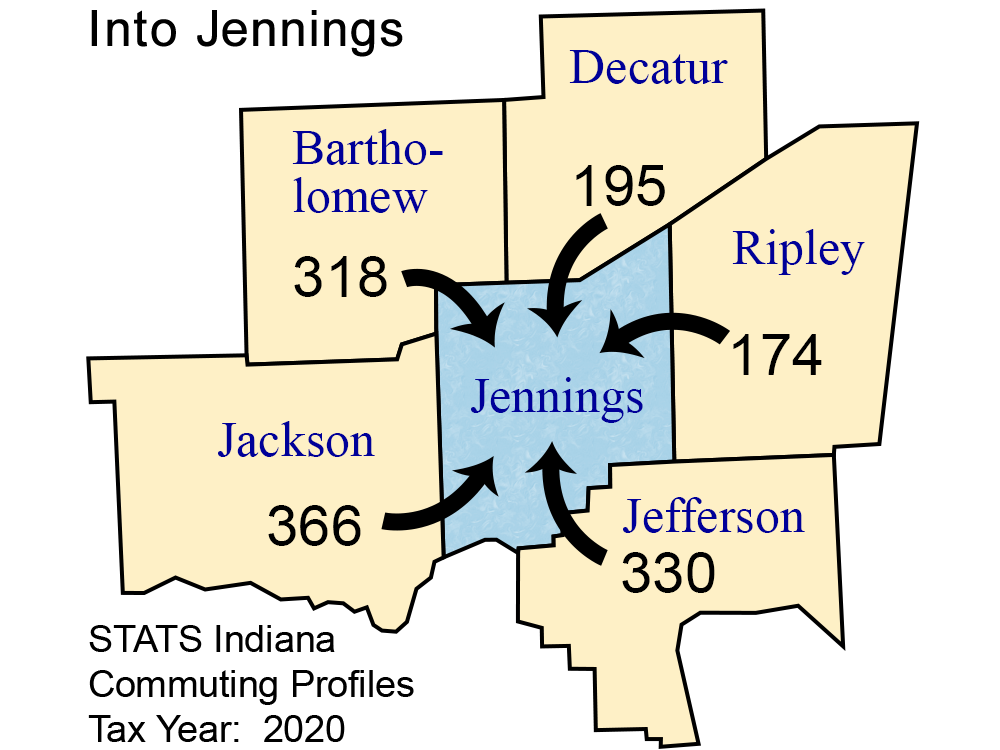
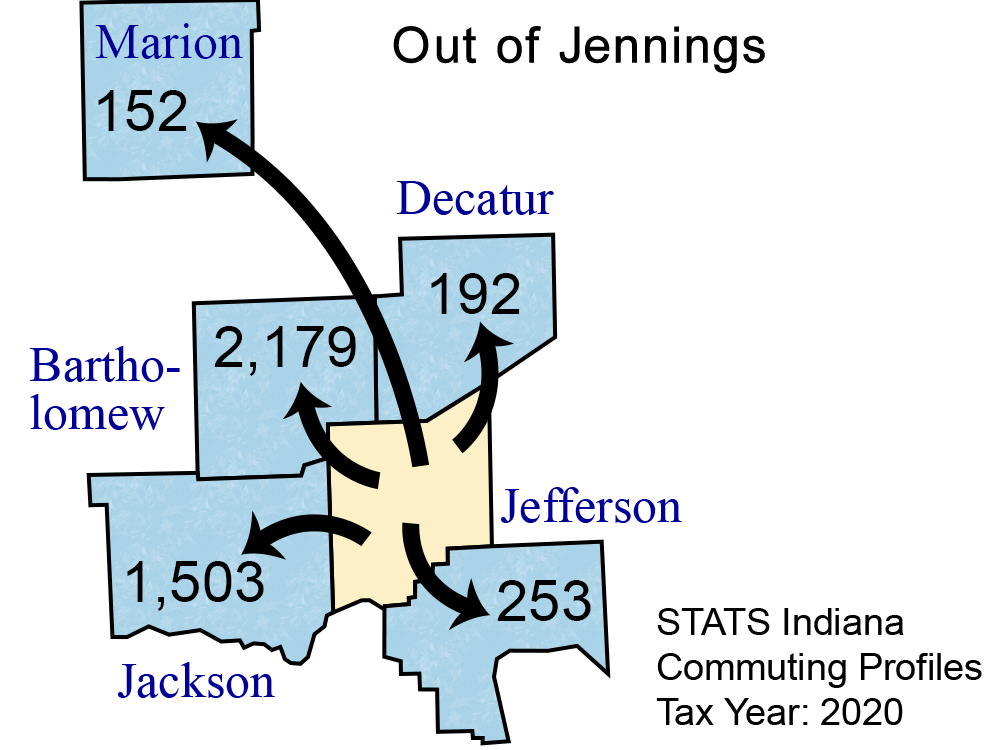
Detailed Commuting Table for Jennings County
(Includes counties where 10 or more people either commute into or out of this county)
| County Name | Commute INTO Jennings County | % of Jennings County Workforce |
Commute FROM Jennings County To: | % of Jennings County Labor Force |
|---|
| Bartholomew County | 318 | 2.2 | 2,179 | 12.2 |
| Brown County | 11 | 0.1 | 7 | 0.0 |
| Clark County | 19 | 0.1 | 30 | 0.2 |
| Daviess County | 17 | 0.1 | 0 | 0.0 |
| Dearborn County | 10 | 0.1 | 11 | 0.1 |
| Decatur County | 195 | 1.3 | 192 | 1.1 |
| Floyd County | 0 | 0.0 | 15 | 0.1 |
| Franklin County | 10 | 0.1 | 1 | 0.0 |
| Hamilton County | 12 | 0.1 | 6 | 0.0 |
| Jackson County | 366 | 2.5 | 1,503 | 8.4 |
| Jefferson County | 330 | 2.2 | 253 | 1.4 |
| Johnson County | 34 | 0.2 | 58 | 0.3 |
| Lake County | 13 | 0.1 | 4 | 0.0 |
| Marion County | 41 | 0.3 | 152 | 0.9 |
| Monroe County | 6 | 0.0 | 23 | 0.1 |
| Out of State | 30 | 0.2 | 108 | 0.6 |
| Ripley County | 174 | 1.2 | 64 | 0.4 |
| Scott County | 96 | 0.6 | 86 | 0.5 |
| Shelby County | 16 | 0.1 | 35 | 0.2 |
| Washington County | 10 | 0.1 | 2 | 0.0 |
| Kentucky | 11 | 0.1 | 36 | 0.2 |
Note: Commuters to/from Illinois, Michigan, Kentucky, Ohio, Wisconsin, and Pennsylvania are shown separately and are not included in the "Out of State" category.
Note: These figures are provided to give a summary of commuting patterns, not employment patterns, and will not match labor force or employment numbers from sources like the Bureau of Labor Statistics.
Source: IBRC, using Indiana Department of Revenue data
This table was produced by STATS Indiana on Aug 25, 2022