Detailed Commuting Table for Lake County
(Includes counties where 10 or more people either commute into or out of this county)
| County Name | Commute INTO Lake County | % of Lake County Workforce |
Commute FROM Lake County To: | % of Lake County Labor Force |
|---|
| Adams County | 10 | 0.0 | 34 | 0.0 |
| Allen County | 27 | 0.0 | 55 | 0.0 |
| Boone County | 9 | 0.0 | 15 | 0.0 |
| Cass County | 2 | 0.0 | 10 | 0.0 |
| Clark County | 9 | 0.0 | 18 | 0.0 |
| Clinton County | 1 | 0.0 | 12 | 0.0 |
| Delaware County | 9 | 0.0 | 51 | 0.0 |
| Elkhart County | 18 | 0.0 | 40 | 0.0 |
| Fulton County | 27 | 0.0 | 8 | 0.0 |
| Hamilton County | 38 | 0.0 | 40 | 0.0 |
| Hendricks County | 15 | 0.0 | 13 | 0.0 |
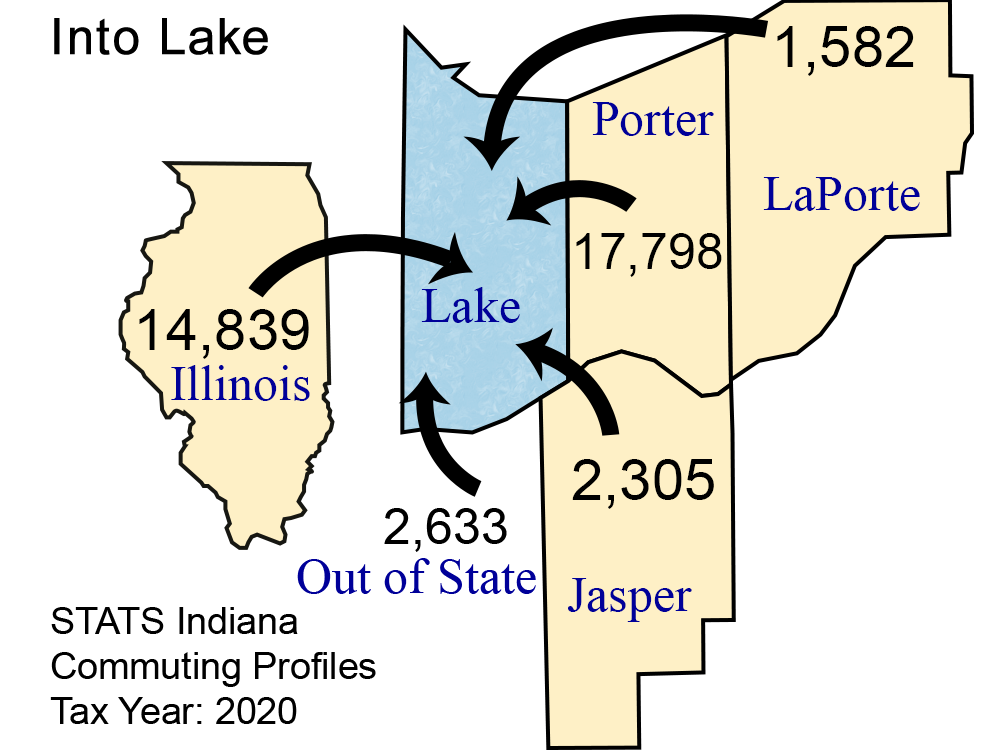
| Jasper County | 2,305 | 0.8 | 277 | 0.1 |
| Jennings County | 4 | 0.0 | 13 | 0.0 |
| Johnson County | 22 | 0.0 | 24 | 0.0 |
| Knox County | 14 | 0.0 | 15 | 0.0 |
| Kosciusko County | 20 | 0.0 | 27 | 0.0 |
| LaGrange County | 23 | 0.0 | 41 | 0.0 |
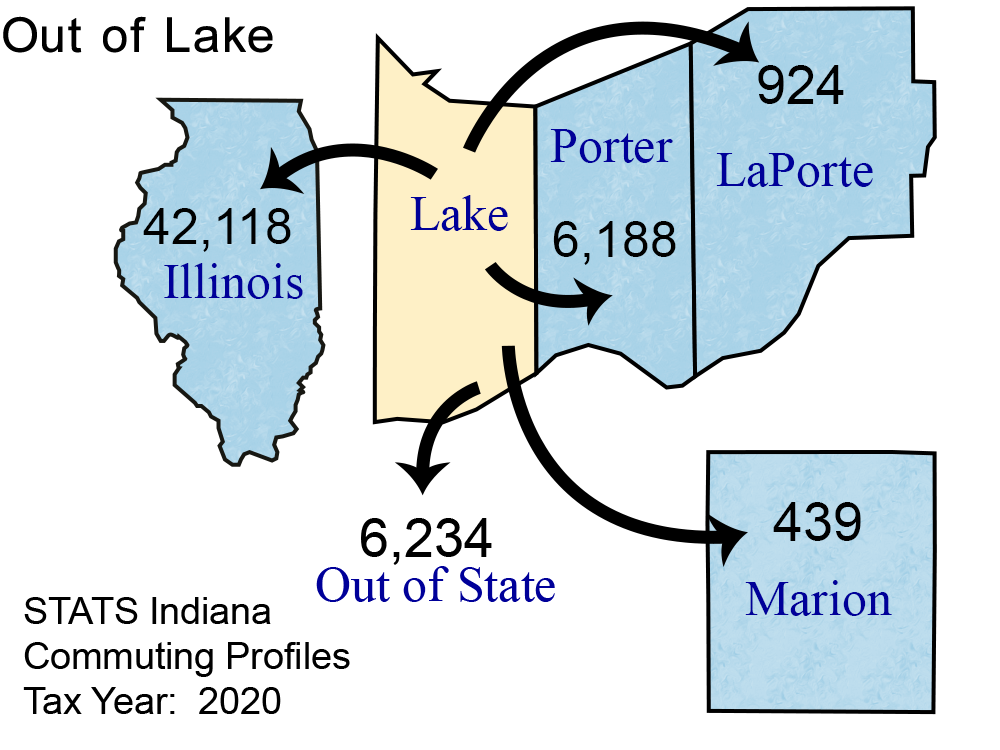
| LaPorte County | 1,582 | 0.5 | 924 | 0.3 |
| Madison County | 11 | 0.0 | 12 | 0.0 |
| Marion County | 106 | 0.0 | 439 | 0.1 |
| Marshall County | 38 | 0.0 | 15 | 0.0 |
| Monroe County | 18 | 0.0 | 183 | 0.1 |
| Montgomery County | 3 | 0.0 | 16 | 0.0 |
| Newton County | 1,289 | 0.4 | 117 | 0.0 |
| Ohio County | 4 | 0.0 | 14 | 0.0 |
| Out of State | 2,633 | 0.9 | 6,234 | 2.0 |
| Porter County | 17,798 | 6.2 | 6,188 | 2.0 |
| Pulaski County | 72 | 0.0 | 10 | 0.0 |
| St Joseph County | 135 | 0.0 | 152 | 0.0 |
| Starke County | 339 | 0.1 | 23 | 0.0 |
| Tippecanoe County | 43 | 0.0 | 261 | 0.1 |
| Vanderburgh County | 5 | 0.0 | 12 | 0.0 |
| Vigo County | 9 | 0.0 | 60 | 0.0 |
| Wabash County | 7 | 0.0 | 12 | 0.0 |
| White County | 46 | 0.0 | 19 | 0.0 |
| Illinois | 14,839 | 5.1 | 42,118 | 13.8 |
| Kentucky | 106 | 0.0 | 247 | 0.1 |
| Michigan | 238 | 0.1 | 173 | 0.1 |
| Ohio (State) | 65 | 0.0 | 55 | 0.0 |
| Pennsylvania | 23 | 0.0 | 30 | 0.0 |
| Wisconsin | 165 | 0.1 | 329 | 0.1 |
Note: Commuters to/from Illinois, Michigan, Kentucky, Ohio, Wisconsin, and Pennsylvania are shown separately and are not included in the "Out of State" category.
Note: These figures are provided to give a summary of commuting patterns, not employment patterns, and will not match labor force or employment numbers from sources like the Bureau of Labor Statistics.
Source: IBRC, using Indiana Department of Revenue data
This table was produced by STATS Indiana on Aug 25, 2022