Detailed Commuting Table for Vanderburgh County
(Includes counties where 10 or more people either commute into or out of this county)
| County Name | Commute INTO Vanderburgh County | % of Vanderburgh County Workforce |
Commute FROM Vanderburgh County To: | % of Vanderburgh County Labor Force |
|---|
| Adams County | 1 | 0.0 | 13 | 0.0 |
| Clark County | 20 | 0.0 | 10 | 0.0 |
| Crawford County | 18 | 0.0 | 2 | 0.0 |
| Daviess County | 114 | 0.1 | 46 | 0.0 |
| Dubois County | 230 | 0.2 | 125 | 0.1 |
| Floyd County | 17 | 0.0 | 10 | 0.0 |
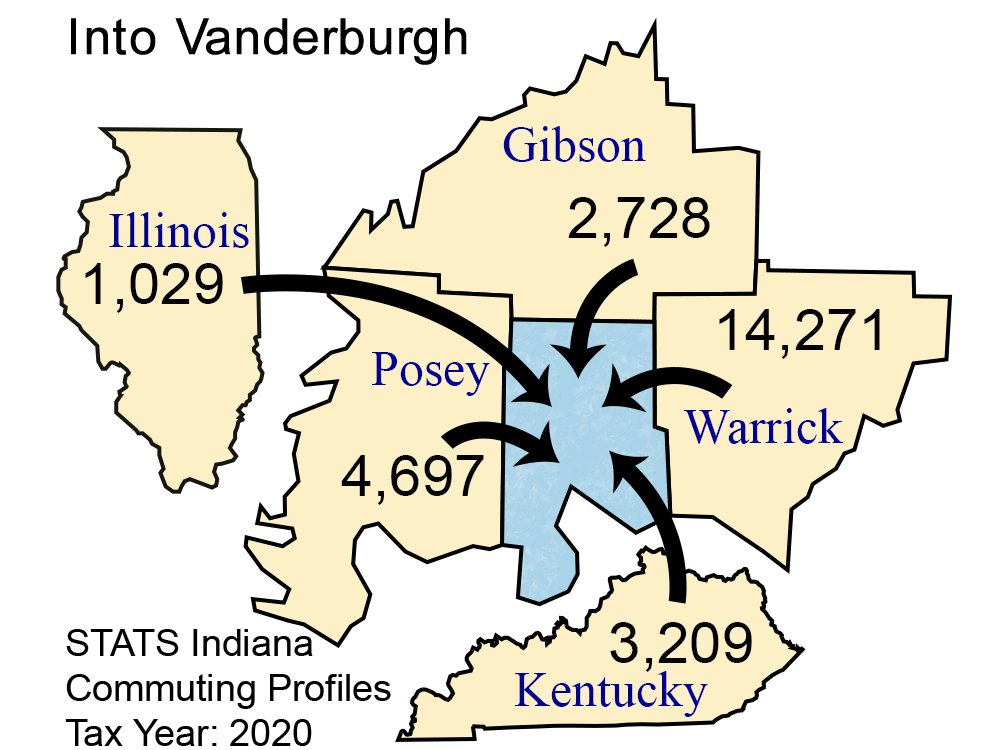
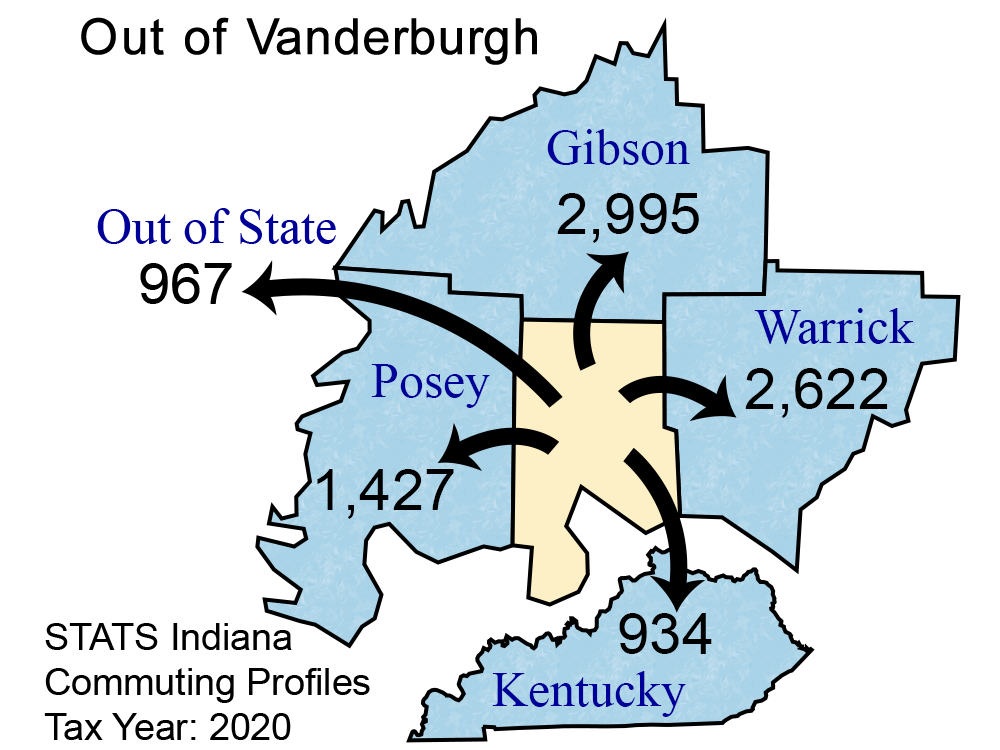
| Gibson County | 2,728 | 2.0 | 2,995 | 2.5 |
| Greene County | 21 | 0.0 | 7 | 0.0 |
| Hamilton County | 43 | 0.0 | 16 | 0.0 |
| Hancock County | 11 | 0.0 | 6 | 0.0 |
| Harrison County | 10 | 0.0 | 2 | 0.0 |
| Hendricks County | 23 | 0.0 | 12 | 0.0 |
| Jefferson County | 11 | 0.0 | 4 | 0.0 |
| Johnson County | 26 | 0.0 | 6 | 0.0 |
| Knox County | 165 | 0.1 | 67 | 0.1 |
| Lake County | 12 | 0.0 | 5 | 0.0 |
| Lawrence County | 11 | 0.0 | 7 | 0.0 |
| Marion County | 67 | 0.0 | 109 | 0.1 |
| Martin County | 17 | 0.0 | 19 | 0.0 |
| Monroe County | 29 | 0.0 | 48 | 0.0 |
| Orange County | 10 | 0.0 | 3 | 0.0 |
| Out of State | 656 | 0.5 | 967 | 0.8 |
| Perry County | 127 | 0.1 | 17 | 0.0 |
| Pike County | 289 | 0.2 | 35 | 0.0 |
| Porter County | 11 | 0.0 | 4 | 0.0 |
| Posey County | 4,697 | 3.4 | 1,427 | 1.2 |
| Spencer County | 902 | 0.7 | 109 | 0.1 |
| Sullivan County | 15 | 0.0 | 0 | 0.0 |
| Tippecanoe County | 12 | 0.0 | 21 | 0.0 |
| Union County | 5 | 0.0 | 10 | 0.0 |
| Vigo County | 11 | 0.0 | 28 | 0.0 |
| Wabash County | 9 | 0.0 | 14 | 0.0 |
| Warrick County | 14,271 | 10.3 | 2,622 | 2.2 |
| Whitley County | 6 | 0.0 | 10 | 0.0 |
| Illinois | 1,029 | 0.7 | 152 | 0.1 |
| Kentucky | 3,209 | 2.3 | 934 | 0.8 |
| Michigan | 15 | 0.0 | 7 | 0.0 |
| Ohio (State) | 41 | 0.0 | 18 | 0.0 |
| Pennsylvania | 15 | 0.0 | 6 | 0.0 |
| Wisconsin | 49 | 0.0 | 15 | 0.0 |
Note: Commuters to/from Illinois, Michigan, Kentucky, Ohio, Wisconsin, and Pennsylvania are shown separately and are not included in the "Out of State" category.
Note: These figures are provided to give a summary of commuting patterns, not employment patterns, and will not match labor force or employment numbers from sources like the Bureau of Labor Statistics.
Source: IBRC, using Indiana Department of Revenue data
This table was produced by STATS Indiana on Aug 25, 2022