Detailed Commuting Table for Vermillion County
(Includes counties where 10 or more people either commute into or out of this county)
| County Name | Commute INTO Vermillion County | % of Vermillion County Workforce |
Commute FROM Vermillion County To: | % of Vermillion County Labor Force |
|---|
| Clay County | 33 | 0.4 | 43 | 0.4 |
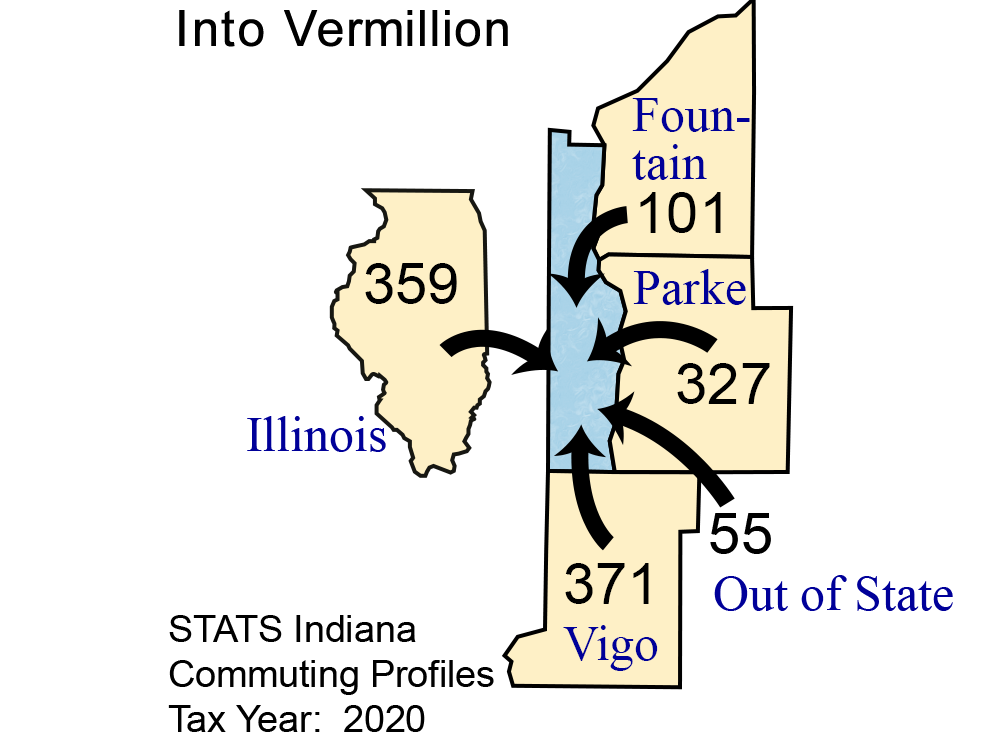
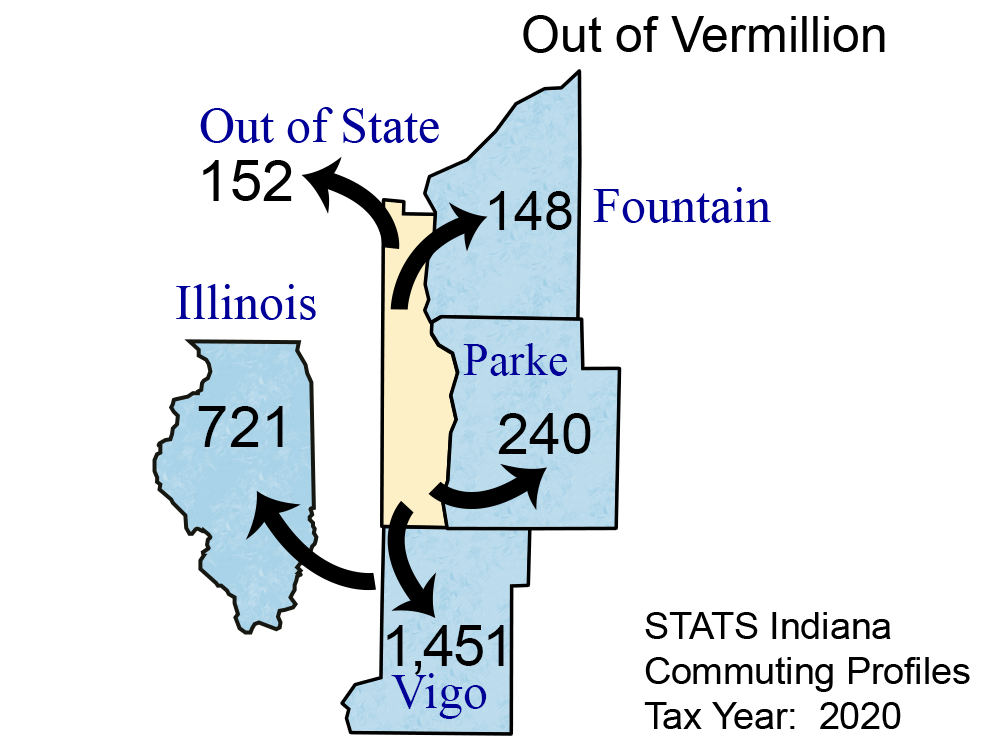
| Fountain County | 101 | 1.2 | 148 | 1.4 |
| Hendricks County | 17 | 0.2 | 15 | 0.1 |
| Marion County | 5 | 0.1 | 53 | 0.5 |
| Montgomery County | 8 | 0.1 | 47 | 0.5 |
| Out of State | 55 | 0.6 | 152 | 1.5 |
| Parke County | 327 | 3.8 | 240 | 2.3 |
| Putnam County | 7 | 0.1 | 12 | 0.1 |
| Sullivan County | 10 | 0.1 | 6 | 0.1 |
| Tippecanoe County | 3 | 0.0 | 28 | 0.3 |
| Vigo County | 371 | 4.3 | 1,451 | 14.0 |
| Warren County | 42 | 0.5 | 42 | 0.4 |
| Illinois | 359 | 4.1 | 721 | 7.0 |
Note: Commuters to/from Illinois, Michigan, Kentucky, Ohio, Wisconsin, and Pennsylvania are shown separately and are not included in the "Out of State" category.
Note: These figures are provided to give a summary of commuting patterns, not employment patterns, and will not match labor force or employment numbers from sources like the Bureau of Labor Statistics.
Source: IBRC, using Indiana Department of Revenue data
This table was produced by STATS Indiana on Aug 25, 2022