Detailed Commuting Table for Vigo County
(Includes counties where 10 or more people either commute into or out of this county)
| County Name | Commute INTO Vigo County | % of Vigo County Workforce |
Commute FROM Vigo County To: | % of Vigo County Labor Force |
|---|
| Allen County | 23 | 0.0 | 12 | 0.0 |
| Bartholomew County | 12 | 0.0 | 3 | 0.0 |
| Boone County | 33 | 0.0 | 6 | 0.0 |
| Clark County | 13 | 0.0 | 22 | 0.0 |
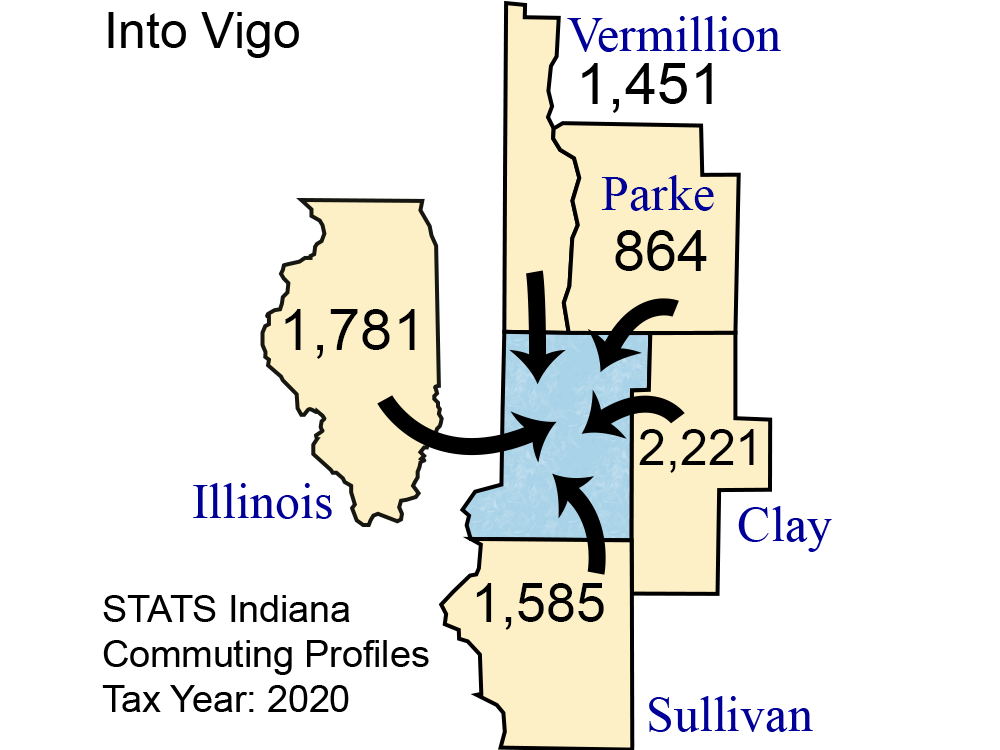
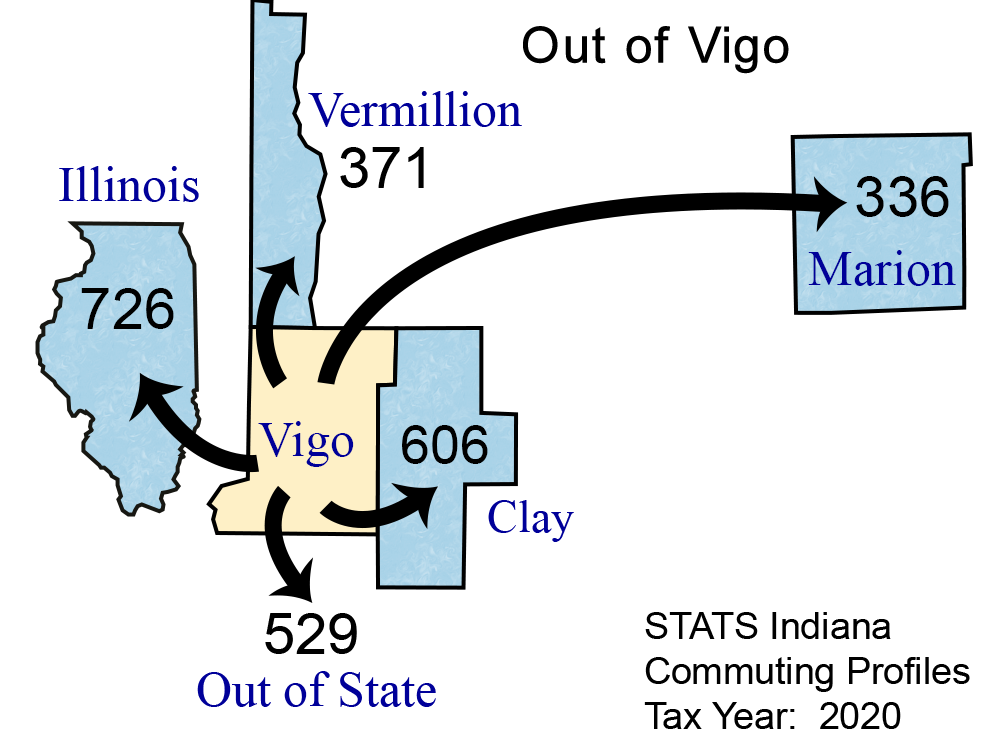
| Clay County | 2,221 | 3.2 | 606 | 1.0 |
| Daviess County | 13 | 0.0 | 7 | 0.0 |
| Fountain County | 50 | 0.1 | 13 | 0.0 |
| Gibson County | 13 | 0.0 | 10 | 0.0 |
| Greene County | 342 | 0.5 | 30 | 0.0 |
| Hamilton County | 94 | 0.1 | 32 | 0.1 |
| Hancock County | 33 | 0.0 | 9 | 0.0 |
| Hendricks County | 167 | 0.2 | 72 | 0.1 |
| Johnson County | 52 | 0.1 | 17 | 0.0 |
| Knox County | 53 | 0.1 | 63 | 0.1 |
| Lake County | 60 | 0.1 | 9 | 0.0 |
| Madison County | 28 | 0.0 | 4 | 0.0 |
| Marion County | 169 | 0.2 | 336 | 0.5 |
| Monroe County | 67 | 0.1 | 99 | 0.2 |
| Montgomery County | 27 | 0.0 | 15 | 0.0 |
| Morgan County | 48 | 0.1 | 14 | 0.0 |
| Out of State | 483 | 0.7 | 529 | 0.8 |
| Owen County | 113 | 0.2 | 22 | 0.0 |
| Parke County | 864 | 1.2 | 161 | 0.3 |
| Porter County | 16 | 0.0 | 1 | 0.0 |
| Putnam County | 181 | 0.3 | 265 | 0.4 |
| St Joseph County | 15 | 0.0 | 3 | 0.0 |
| Shelby County | 10 | 0.0 | 1 | 0.0 |
| Sullivan County | 1,585 | 2.3 | 253 | 0.4 |
| Tippecanoe County | 26 | 0.0 | 20 | 0.0 |
| Vanderburgh County | 28 | 0.0 | 11 | 0.0 |
| Vermillion County | 1,451 | 2.1 | 371 | 0.6 |
| Warren County | 13 | 0.0 | 1 | 0.0 |
| Wayne County | 26 | 0.0 | 28 | 0.0 |
| Illinois | 1,781 | 2.5 | 726 | 1.1 |
| Kentucky | 33 | 0.0 | 13 | 0.0 |
| Michigan | 26 | 0.0 | 1 | 0.0 |
| Ohio (State) | 59 | 0.1 | 6 | 0.0 |
| Pennsylvania | 10 | 0.0 | 4 | 0.0 |
| Wisconsin | 18 | 0.0 | 16 | 0.0 |
Note: Commuters to/from Illinois, Michigan, Kentucky, Ohio, Wisconsin, and Pennsylvania are shown separately and are not included in the "Out of State" category.
Note: These figures are provided to give a summary of commuting patterns, not employment patterns, and will not match labor force or employment numbers from sources like the Bureau of Labor Statistics.
Source: IBRC, using Indiana Department of Revenue data
This table was produced by STATS Indiana on Aug 25, 2022