
Leading Index for Indiana
Updated monthly, the Leading Index for Indiana™ (LII) was developed for Hoosier businesses and governments to provide a signal for changes in the general direction of the Indiana economy. In contrast to The Conference Board’s Leading Economic Index and other national indexes, the LII focuses on key sectors that are important to the Indiana economy. Learn more about the index »
Notice to Users: Regular production of the LII has been discontinued as of October 2014. Learn more »
The Federal Reserve Bank of Philadelphia
produces leading indexes for each of the 50 states, which may prove useful to those looking for an alternative metric given the discontinuation of the LII.

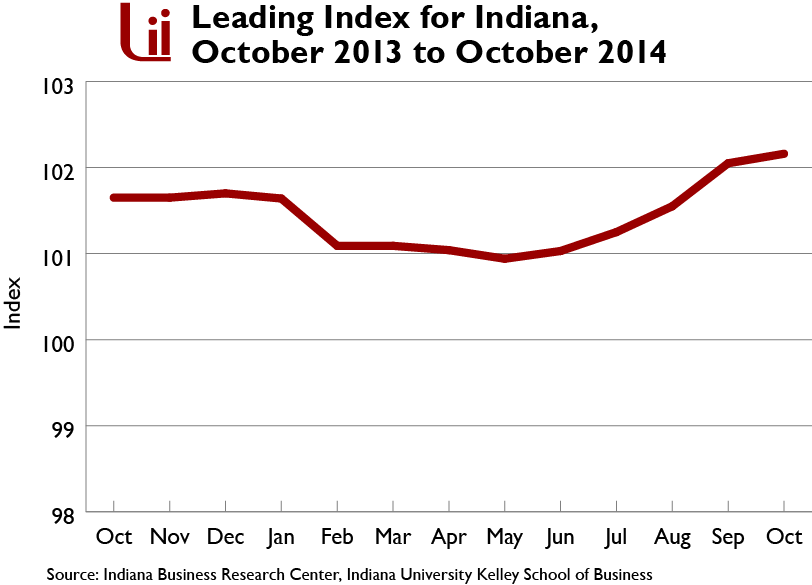
Index for October 2014
The Leading Index for Indiana (LII) rose in October, but less vigorously than in the last several months
| LII Value | 102.2 |
|---|---|
| Change from Previous Month | 0.1% |
| Warning Sign |
No |
The LII for October read 102.2, up a mere 0.1 of a point from a revised September reading of 102.1. A couple components of the LII were in a tug of war, with the ISM manufacturing report tugging the index downward and the transportation and auto sector components unconvincingly pushing the index upward. The drop in home builder sentiment also moderated the index’s rate of ascent.
Small business optimism is still stuck in a rut, well below the pre-recession average. The National Federation of Independent Business (NFIB) small business optimism index dipped in September, giving up 0.8 points, falling to 95.3. Two important components of the index that are directly relevant to GDP growth and hiring—namely plans to increase hiring and plans to make capital investment—fell considerably. As many market analysts may wonder if Wall Street has hit its peak, small businesses are still wondering when they’ll get out of their trench.
This is the last month the LII will be released on a regular basis. To be more relevant, the LII would need to be reconfigured because the interest rate component of the LII has been undercut by Federal Reserve policy. The yield spreads that once foretold of changes in economic growth have proven to be less reliable as a result. While the interest rate spread is only one of five components of the LII, the tenuous relationship in this component would require a rethinking and reconfiguring of the design of the LII.
Leaving on a high note: Based on the Thomson Reuters/University of Michigan preliminary October index reading, consumers are not in a panic about the general weakness in the global economy, about escalating military conflicts, or even about Ebola. The overall index on consumer sentiment rose this month, to the highest reading in more than seven years. "The data show absolutely no signs that fear and panic is about to overtake the consumer sector," said the survey director.
Drivers of Change
-
After four consecutive months of gains, the index of home builder confidence for the short- to medium-term future of the market for newly built single-family homes fell 5 points. That said, the National Association of Home Builders/Wells Fargo Housing Market Index (HMI) registered a 54 which indicates that on balance, home builders are still optimistic—just not as optimistic as last month. The HMI posted a nine-year high last month, so witnessing a drop isn’t a shock.
-
Economic activity in the manufacturing sector expanded in September for the 16th consecutive month, according to the nation’s supply executives in the latest Manufacturing Purchasing Manager’s Index (PMI®) from the Institute for Supply Management. The September PMI® registered 56.6 percent, down 2.4 percentage points from August’s reading of 59 percent. While the PMI fell, is shows a continuing expansion in manufacturing.
-
The auto component of the LII—unfilled orders for automobile bodies and parts—rose by 1.3 percentage points, more than the LII component increased in more than a year and a half. There were 1.2 million light-vehicle sales last month. While down 21.5 percent from the previous month, one needs to remember that August was one of the two highest sales months so far this year. September sales were up 9.3 percent from September 2013, and on a seasonally adjusted annual rate (SAAR), September’s light-vehicle sales were 16.3 million.
-
The transportation and logistics component of the LII, the Dow Jones Transportation Average, rose a modest 0.5 percent.
-
The interest rate spread was virtually unchanged.
Data Revisions
The historical series for the LII reflects regular monthly revisions in source data. Users that analyze historical trends in the LII are encouraged to update the entire data series to eliminate discontinuities in the data.
Source: Indiana Business Research Center, Indiana University Kelley School of Business