Global Positioning, 2015
Indiana's Export Activity
The Indiana Business Research Center (IBRC) monitors global business activity occurring within Indiana’s borders. Click on a tab below for details about the export activity of goods and agricultural products produced in Indiana and sold internationally.
Key Findings
In 2014, the United States exported over $1.6 trillion in goods and services. Of these exports, Indiana’s share was $35.4 billion, $1.3 billion more than in 2013.

Relatively speaking, exports are more important to Indiana than other states. While Indiana’s economic output (GDP) ranks 16th in the country, its dependency on exports ranks eighth.
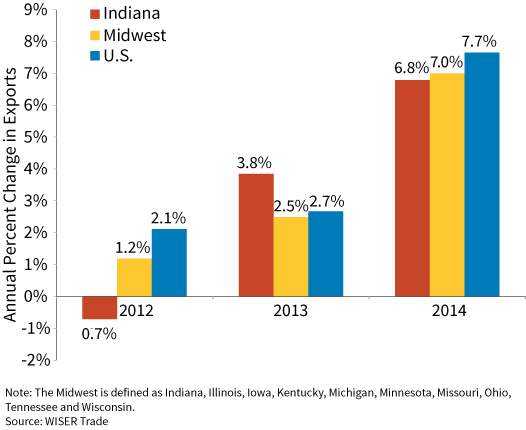
The United States, Midwest, and Indiana all saw a large increase in the annual change in exports in 2014, relative to the past two years. Indiana's exports increased 6.8 percent, which is slightly lower than the 7 percent in the Midwest, and 7.7 percent in the United States.
Figure 1: Annual Change in Exports from Indiana, Midwest and U.S.
Transportation equipment and the life science industries (pharmaceuticals and medical instruments) are the leading export industries.
Table 1: Indiana’s Top Five Export Industries
| Industry | 2014 Exports (in millions) |
Average Annual Growth Rate, 2004-2014 |
|---|---|---|
| Vehicles and Parts (Excluding Railway) | 8,378 | 6.3% |
| Pharmaceutical Products | 5,910 | 21.2% |
| Industrial Machinery (Including Computers) | 5,404 | 5.2% |
| Optical and Medical Instruments | 2,374 | 7.5% |
| Electric Machinery | 2,236 | 4.3% |
Source: WISER Trade

Most of Indiana’s export industries have had strong average annual growth over the last decade, especially aircraft, spacecraft and related parts; pharmaceuticals; iron, steel and related products; optical and medical instruments; and agricultural products.

While many may look to the emerging economies for growth, there may be less potential for expanded export opportunities in the near future. For example, the BRICS countries (Brazil, Russia, India, China and South Africa) are, as a group, not turning in the rates of growth experienced recently.
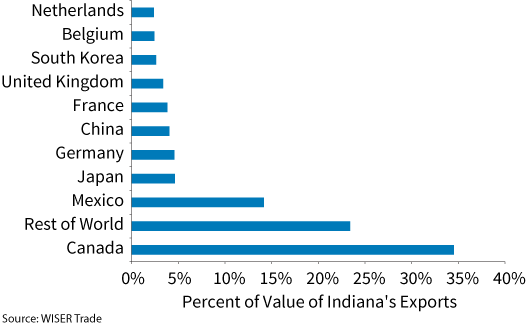
If the weak (perhaps negative) economic growth that is expected in most of the eurozone continues, it will reduce demand for exports, including those from Indiana. On the upside, Canada and Mexico are Indiana’s primary markets.
Figure 2: Indiana’s Leading Export Destinations, 2014
Global Economic and Trade Outlook
The Organization for Economic Cooperation and Development (OECD) projects lethargic growth by the eurozone countries as a whole, though Germany will likely outperform its neighbors.
Table 2: Percent Change in Real GDP from Previous Year
| Actual | Forecast | |||
|---|---|---|---|---|
| Nation | 2013 | 2014 | 2015 | 2016 |
| China | 7.7 | 7.4 | 6.8 | 6.7 |
| United Kingdom | 1.7 | 2.8 | 2.4 | 2.3 |
| Australia | 2.0 | 2.7 | 2.3 | 2.9 |
| Canada | 2.0 | 2.4 | 1.5 | 2.3 |
| United States | 2.2 | 2.4 | 2.0 | 2.8 |
| Mexico | 1.7 | 2.1 | 2.9 | 3.5 |
| Germany | 0.2 | 1.6 | 1.6 | 2.3 |
| Belgium | 0.3 | 1.1 | 1.3 | 1.8 |
| Netherlands | -0.7 | 0.9 | 2.0 | 2.2 |
| Euro Area | -0.3 | 0.9 | 1.4 | 2.1 |
| France | 0.7 | 0.2 | 1.1 | 1.7 |
| Japan | 1.6 | -0.1 | 0.7 | 1.4 |
| Italy | -1.7 | -0.4 | 0.6 | 1.5 |
Note: This table is sorted by the actual 2014 growth rate.
Source: Organization for Economic Cooperation and Development
Since the end of the recession, foreign exchange trends have been mixed—a tug of war between monetary policy and a flight to safety into dollars.
Figure 3: Foreign Exchange Trends for Indiana's Top Trading Partners
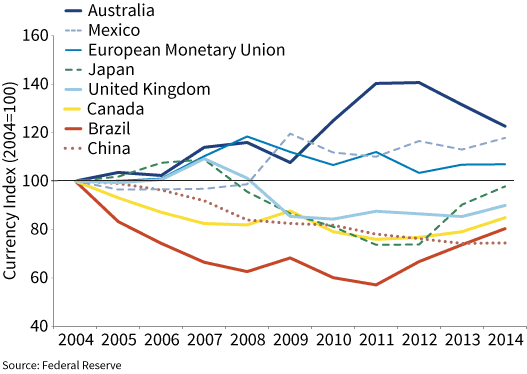
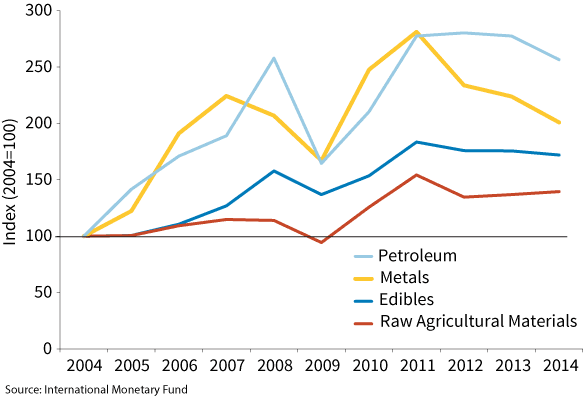
While a weakening dollar tends to encourage export sales, it also can increase raw commodity prices, thus discouraging demand. Across all categories in 2014, commodity prices saw either declines or no change.
Figure 4: World Primary Commodity Prices
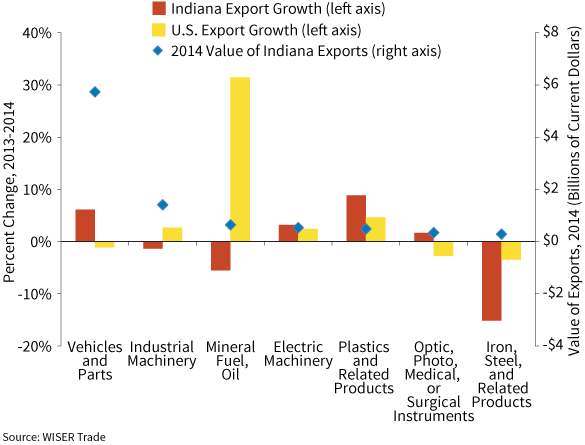
Canada dominates Indiana’s export market. Vehicles and parts remained Indiana’s top exported commodity to that country, increasing 6.1 percent from 2013 to 2014.
Figure 5: Value and Growth of Exports to Canada by Industry, Comparison of U.S. and Indiana
While the traditional trading partners of Canada, Mexico, Japan and Europe are still dominant, emerging economies are becoming increasingly important.
Table 3: Trade Activity of the United States, Brazil, China and India
| Realized Average Annual Growth Rate, 2004-2014 | Projected Average Annual Growth Rate, 2015-2016 | |||
|---|---|---|---|---|
| Nation | Imports | Exports | Imports | Exports |
| United States | 2.2% | 4.7% | 6.4% | 3.3% |
| Brazil | 9.5% | 2.9% | -0.5% | -0.4% |
| China | 10.0% | 11.0% | 6.4% | 5.6% |
| India | 11.2% | 11.0% | 4.4% | 6.0% |
Note: Data for Russia and South Africa are unavailable.
Source: Organization for Economic Cooperation and Development
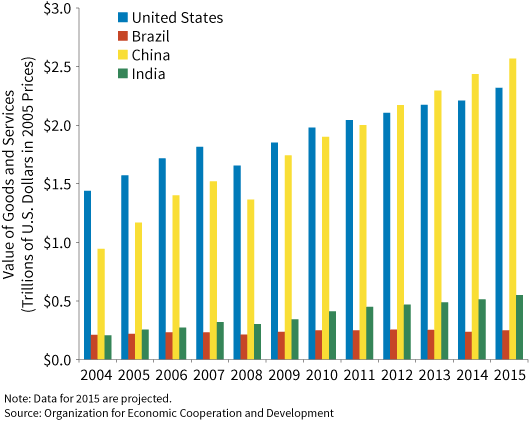
China is the dominant emerging economy and has had one of the highest growth rates for both imports and exports.
Figure 6: Exports from the United States, Brazil, China and India
Indiana Export Trends
Figure 7: Indiana Exports
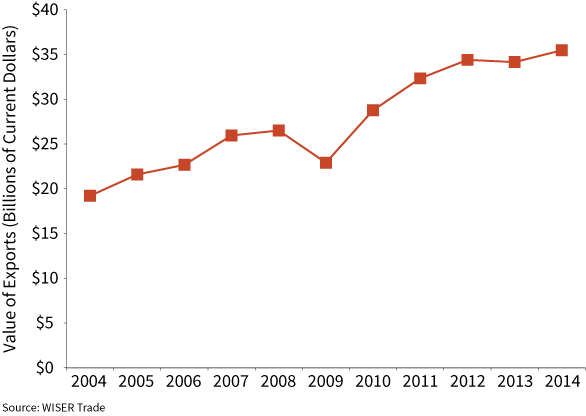
Except for a recession-induced dip in 2009—and the weak European demand in 2013 due to the continent’s anemic growth—Indiana’s exports have steadily risen over the past 10 years.
The export value has nearly doubled since 2004, from $19.2 billion to $35.5 billion in 2014.
Figure 8: Annual Change in Exports
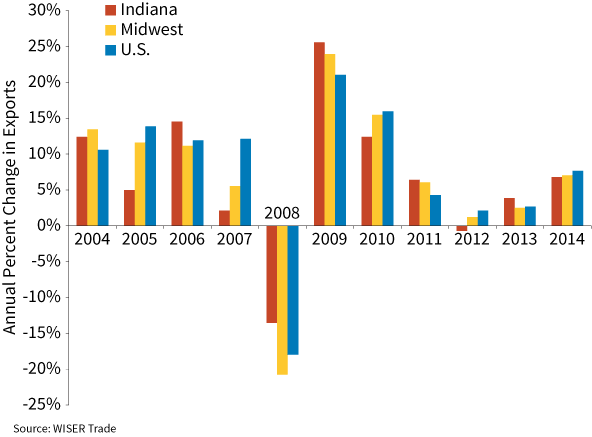
Indiana recovered from the recession more quickly than the Midwest or United States. Since 2004, Indiana’s year-to-year export growth has outperformed the Midwest and nation five times.
Figure 9: Comparing Indiana's Growth in Exports and GDP by Industry, 2008 to 2013
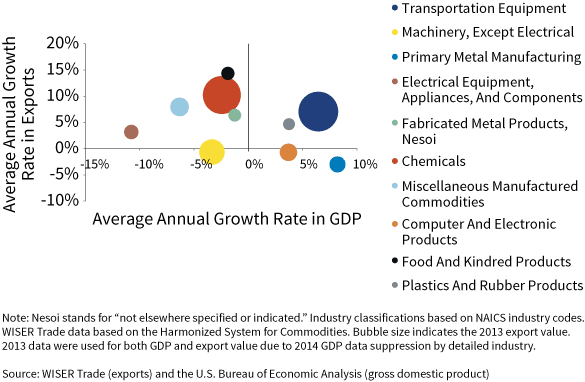
Between 2008 and 2013, almost all of Indiana’s top 10 exporting industries enjoyed greater average annual rates of growth than their average annual GDP growth.
The top two industries in 2013 export volume had differing effects on the state’s average annual GDP growth, with chemicals experiencing a decline of nearly 2 percent and transportation equipment increasing by over 6 percent.
Figure 10: Comparing State Economies on Export Dependency, 2014
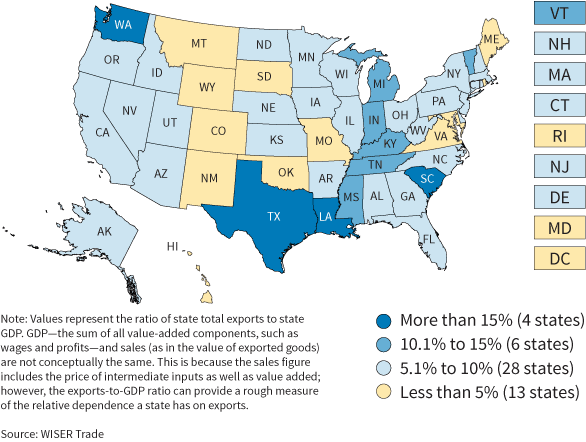
Indiana’s economy is dependent on exports to a larger degree than most other states. In terms of export dependency, measured by the ratio of exports to GDP, Indiana ranked 8th at 11.2 percent.
Four states had ratios greater than 15 percent, with Louisiana having the highest dependency at 25.8 percent.
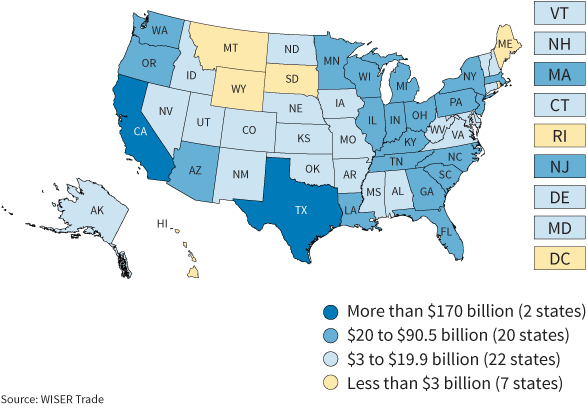
Texas and California dominate in terms of the dollar value of export sales by state, with exports valued at $288 billion and $173.8 billion, respectively. Indiana held its own at 13th place.
Figure 11 : Value of Exports by State in Current Dollars, 2014
Since 2012, state-level export growth has been volatile. Indiana’s average annual growth rate from 2012 to 2014 was 1.5 percent, less than the U.S. average of 2.4 percent.
Figure 12: Average Annual Rate of Change in Exports, 2012 to 2014
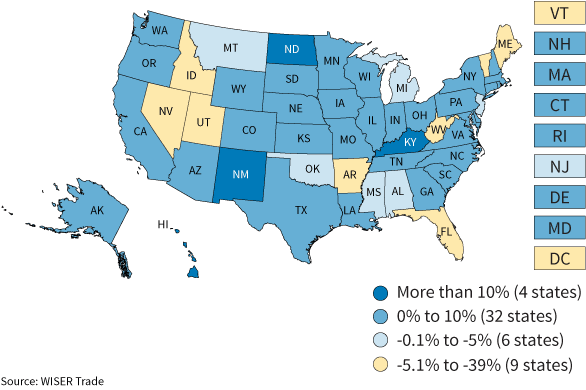
Figure 13: 10-Year Export Trends Compared to Recent Performance in the Midwest
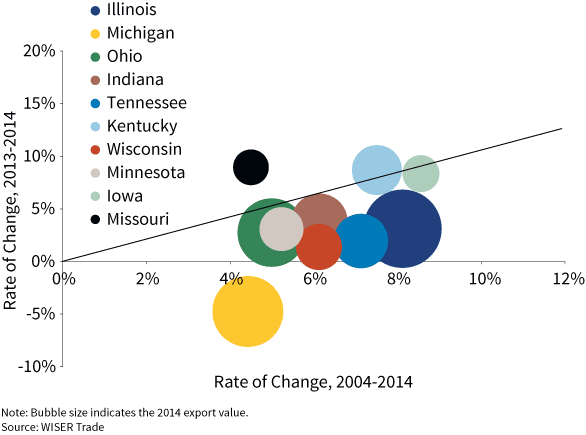
A bubble above the diagonal line in Figure 13 indicates that the most recent year’s growth exceeds the 2004 to 2014 trend. Missouri’s exports accelerated greatly in 2014, while most of the remaining Midwestern states saw little change in export growth.
Figure 14: Export Index for Select Midwestern States
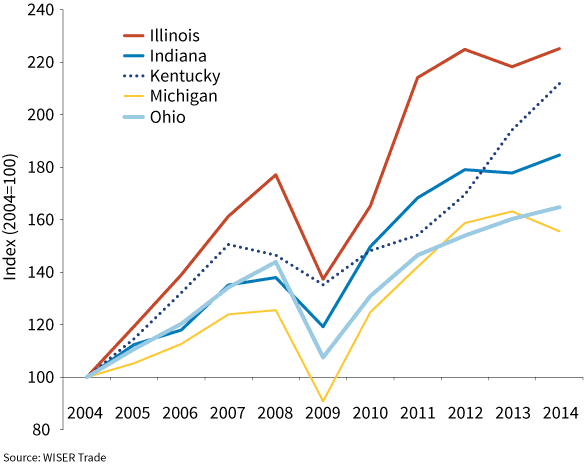
Illinois and Kentucky’s export growth from 2004 to 2014 has rivaled that of Indiana.
Indiana Export Destinations
Canada and Mexico are Indiana’s top two export markets. In 2014, Canada captured 34.5 percent of the state’s exports, whereas Mexico accounted for 14.2 percent of Indiana’s exports.
The top 10 destinations accounted for approximately 75 percent of Indiana’s exports in 2014.
Table 4 : Indiana’s Top Export Destinations—Value and Average Annual Rate of Change
| Export Destination | Value of Exports (Millions of Current Dollars) | Average Annual Rate of Change | ||||
|---|---|---|---|---|---|---|
| 2012 | 2013 | 2014 | 2013-2014 | 2009-2014 | 2004-2014 | |
| World Total | 34,399 | 34,155 | 35,467 | 3.8% | 8.7% | 6.1% |
| Canada | 11,900 | 11,817 | 12,246 | 3.6% | 7.5% | 3.5% |
| Mexico | 3,907 | 4,001 | 5,022 | 25.5% | 20.7% | 6.8% |
| Japan | 1,752 | 1,805 | 1,644 | -8.9% | 0.2% | 2.5% |
| Germany | 2,156 | 1,928 | 1,624 | -15.8% | 4.6% | 3.2% |
| China | 1,309 | 1,346 | 1,436 | 6.7% | 2.8% | 9.1% |
| France | 1,767 | 1,387 | 1,354 | -2.4% | 9.9% | 6.3% |
| United Kingdom | 1,199 | 1,038 | 1,197 | 15.3% | 6.4% | 14.0% |
| South Korea | 788 | 874 | 933 | 6.8% | 11.2% | 13.1% |
| Belgium | 534 | 449 | 867 | 93.0% | 10.2% | 8.5% |
| Netherlands | 788 | 1,174 | 844 | -28.1% | 13.3% | 12.3% |
Source: WISER Trade
Figure 15: 10-Year Export Trends Compared to Recent Performance for Indiana's Top 10 Destinations
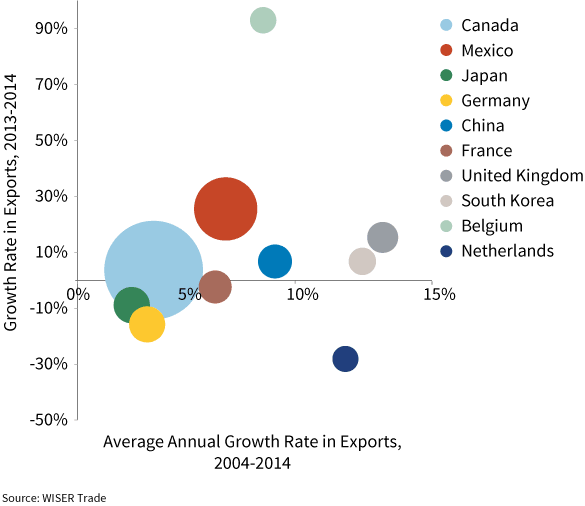
In Canada, France, and the United Kingdom, export growth (or export shrinkage in the case of the United Kingdom) has not keep pace with the average over the last 10 years.
Most of the countries for which Indiana exports have been declining—Japan, Germany, and the Netherlands, for example—have been experiencing overall lackluster economic performance.
Exports to Indiana’s top 10 partners have experienced some dramatic swings from year to year.
Figure 16: Annual Change in Exports for Indiana's Top 10 Export Destinations
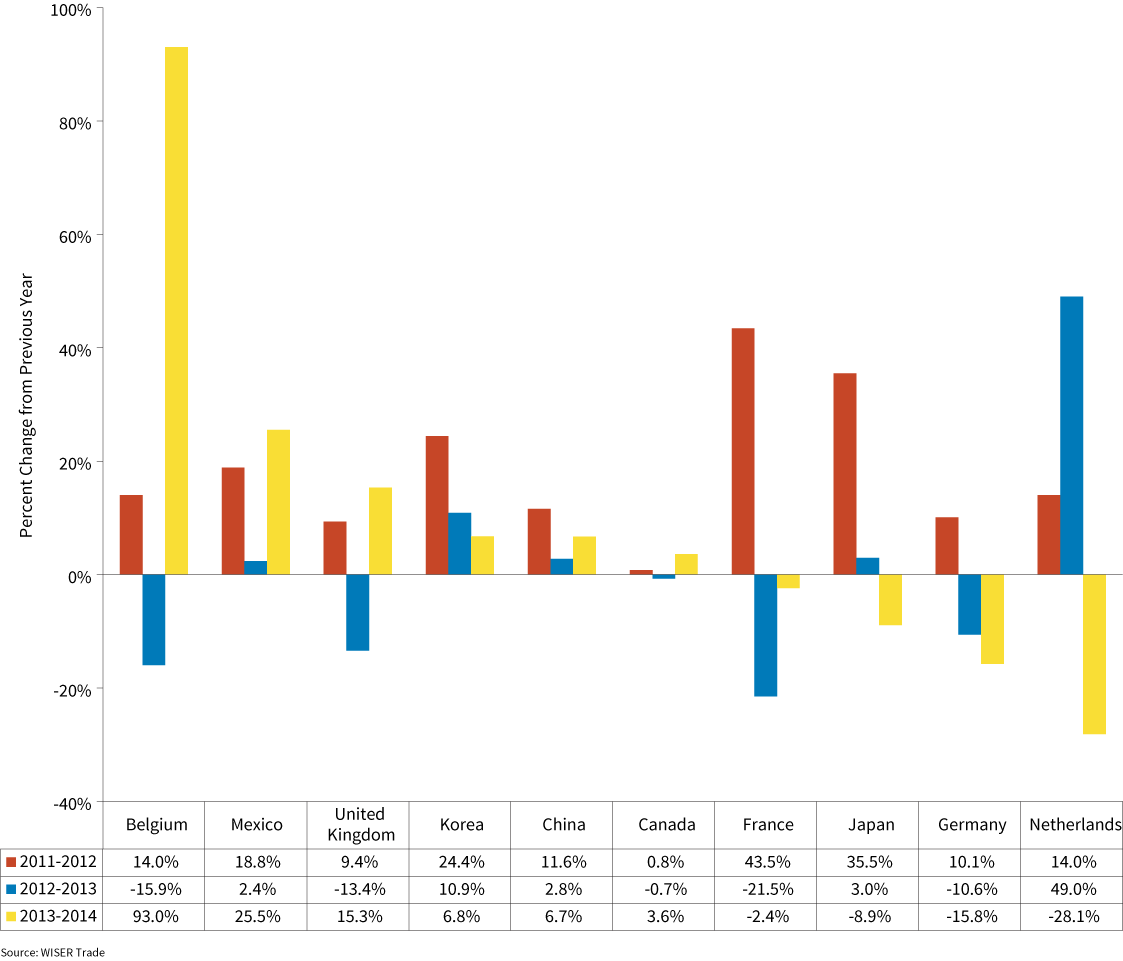
Figure 17: Destinations of Indiana Exports Exceeding $100 Million, 2014
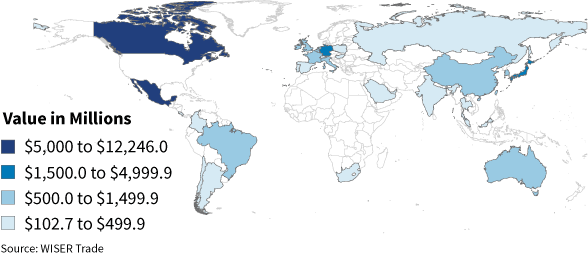
While about 200 destinations imported Indiana goods in 2014, only 33 had export values greater than $100 million. These 33 countries accounted for 95.5 percent of all Indiana exports.
Figure 18: Indiana’s Average Annual Export Growth by Destination, 2012 to 2014
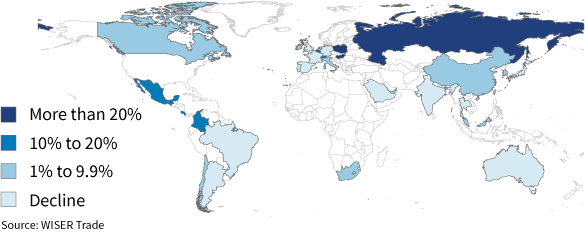
The average annual growth rate from 2012 to 2014 for countries importing over $100 million was 3.4 percent—higher than the 1.5 percent for all of Indiana’s export destinations. Import growth levels in the eurozone countries have varied considerably, reflecting the knock-on effects of Europe’s general economic stagnation.
Figure 19: Export Index for Countries Importing More than $1 Billion of Indiana Goods in 2014
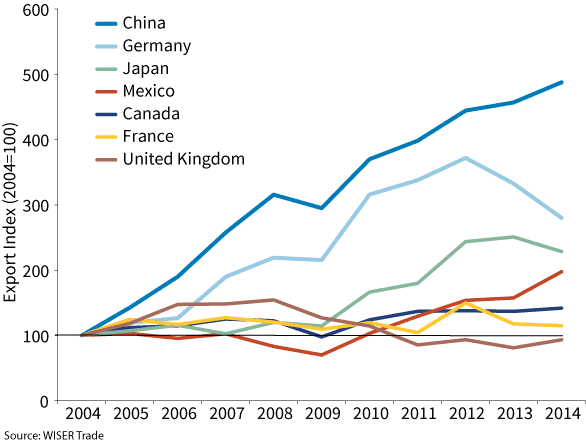
Seven destinations imported more than $1 billion from Indiana in 2014. China and Germany had the most dramatic and consistent growth over the past decade, though exports to Germany have been declining since 2012.
Looking at the top five export industries, vehicles and parts increased over $800 million from 2013 to 2014, with Canada contributing 40 percent of the increase.
Canada and Mexico trade heavily in vehicle and parts and industrial machinery—the latter industry also includes components to transportation equipment like diesel engines.
Table 5: Change in the Value of Exports by Destination for Five of Indiana’s Largest Exporting Industries, 2013 to 2014
| Destination | Vehicles and Parts (Excluding Railway) | Pharmaceutical Products | Industrial Machinery | Optical and Medical Instruments | Electric Machinery |
|---|---|---|---|---|---|
| World Total | 817.5 | -393.7 | 127.4 | -92.2 | 95.5 |
| Canada | 331.9 | 36.8 | -19.0 | --51.8 | -37.4 |
| Mexico | 163.4 | 29.4 | 350.4 | 68.1 | 99.9 |
| Japan | -5.5 | -54.1 | -37.8 | -99.8 | -10.9 |
| Germany | 12.7 | -325.0 | 5.4 | -68.2 | 1.1 |
| China | -29.6 | 40.2 | 21.1 | -9.4 | 35.0 |
| France | -4.0 | 3.2 | 11.1 | 12.1 | 16.3 |
| United Kingdom | -12.5 | 6.9 | -8.5 | 5.4 | 5.4 |
| South Korea | 13.4 | 12.3 | 17.9 | -6.4 | 4.2 |
| Belgium | 56.1 | 370.3 | -5.0 | -8.2 | -5.1 |
| Netherlands | -0.4 | -412.2 | -46.0 | 89.9 | 1.8 |
Note: Values are in millions of dollars.
Source: WISER Trade
Figure 20: Indiana Exports to Canada by Industry
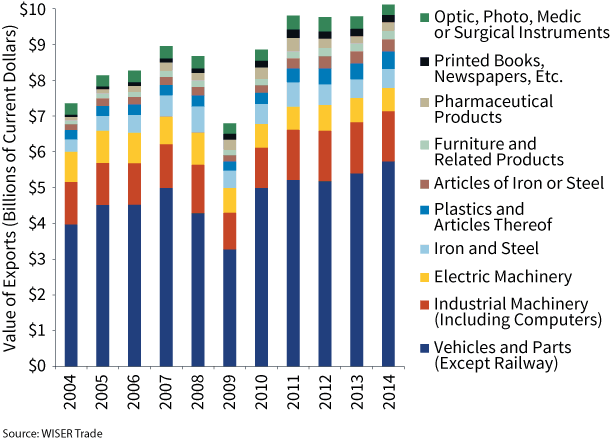
In 2014, the top 10 Indiana shipments to Canada increased by $330.3 million, or 9.8 percent.
Figure 21: Indiana Exports to Mexico by Industry
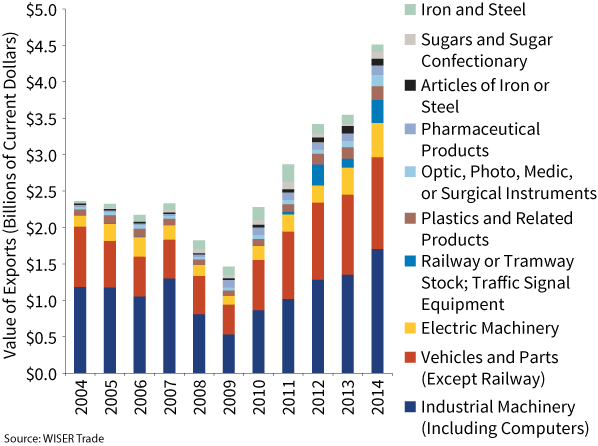
The top 10 Indiana exports to Mexico increased by $962.5 million in 2014, with nearly all of the top 10 exporting industries to Mexico experiencing an increase. The only exception was in iron, steel and related products. Optical and medical equipment exports to Mexico increased significantly, by about $68 million, from 2013 to 2014.
Figure 22: Indiana Exports to Japan by Industry
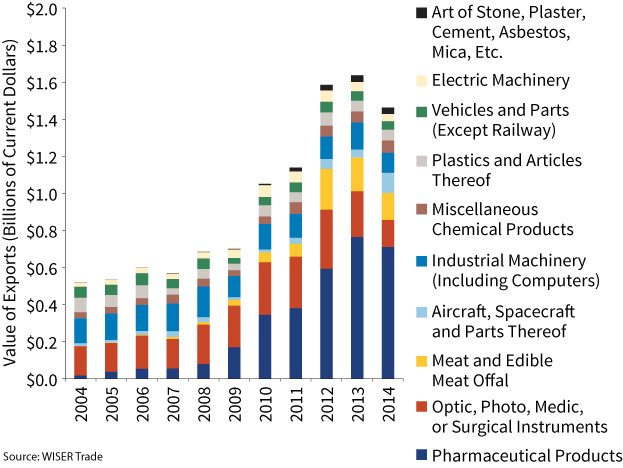
Nearly half of Japan’s imports were in pharmaceuticals. Indiana’s top 10 exports to Japan dropped by $174.1 million (9.5 percent) from 2013 to 2014. Optical and medical equipment exports contributed mightily to that decline, decreasing about $100 million.
Indiana Export Industries
Table 6: Indiana's Top 10 Export Industries
| Exports (in millions) | Average Annual Growth Rate | ||
|---|---|---|---|
| 2014 | 2013-2014 | 2004-2014 | |
| Vehicles and Parts (Except Railway) | $8,378 | 10.8% | 4.3% |
| Pharmaceutical Products | $5,910 | -6.2% | 18.1% |
| Industrial Machinery (Including Computers) | $5,404 | 2.4% | 4.0% |
| Optical and Medical Instruments | $2,374 | -3.7% | 7.1% |
| Electric Machinery | $2,236 | 4.5% | 3.6% |
| Plastics and Related Products | $1,330 | 4.8% | 5.6% |
| Iron, Steel and Related Products | $1,244 | 0.5% | 6.8% |
| Aircraft, Spacecraft, and Related Parts | $1,024 | -8.6% | 7.6% |
| Organic Chemicals | $969 | 18.8% | -4.5% |
| Miscellaneous Chemical Products | $816 | 10.9% | 2.0% |
Note: Industries are defined by the Harmonized System of Commodity Classifications.
Source: WISER Trade
Vehicles and parts are the perennial top as Indiana’s largest export industry in 2014, with a slight increase in export value this past year. Pharmaceutical products maintained its number two spot ahead of industrial machinery despite a small decline in 2014.
The top 10 export categories constitute 83.7 percent of all exports out of Indiana.
Figure 23: Indiana's Top 10 Export Industries and Their Growth
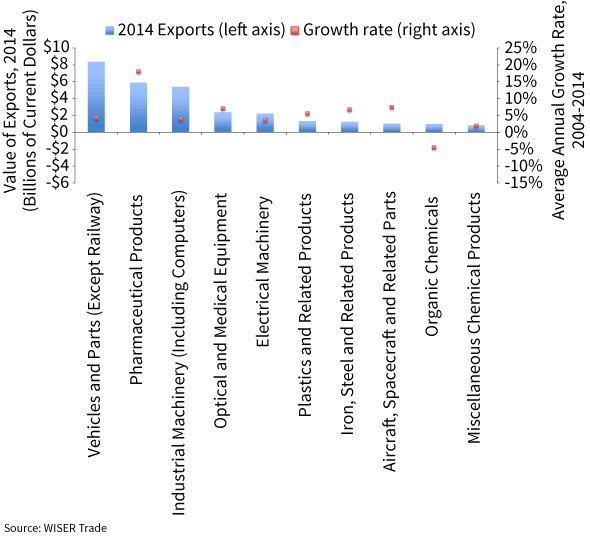
Since 2004, only one of Indiana’s top 10 industries has had double-digit average annual growth (pharmaceutical products, 18.1 percent), as shown in Figure 23.
Vehicles
Canadian purchases of vehicles and parts have slowly rebounded since the downturn in 2009. The share of vehicles and parts earmarked for Canada has slowly dwindled from 58 percent in 1999 to 37.8 percent in 2014. Mexico—America’s second-largest trading partner—has seen a slight decrease in its share of vehicles and parts, commanding 15.6 percent of U.S. exports in 2014, down from 16.1 percent in 2013.
Figure 24: Destinations for U.S. Exports of Vehicles and Parts (Excluding Railway), 2014
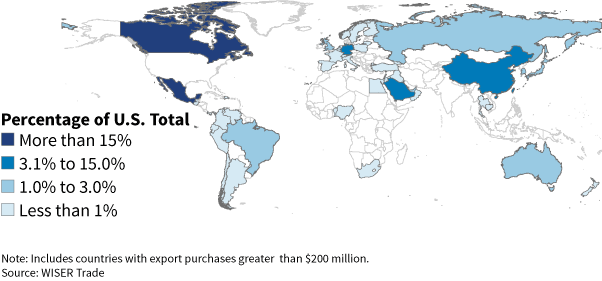
Michigan is the leading source of U.S. vehicle and parts exports with a 16.3 percent share, followed by Texas at 8.9 percent. In 2014, Indiana ranked sixth at 6.2 percent.
Figure 25: Share of U.S. Vehicle Exports (Excluding Railway), 2014
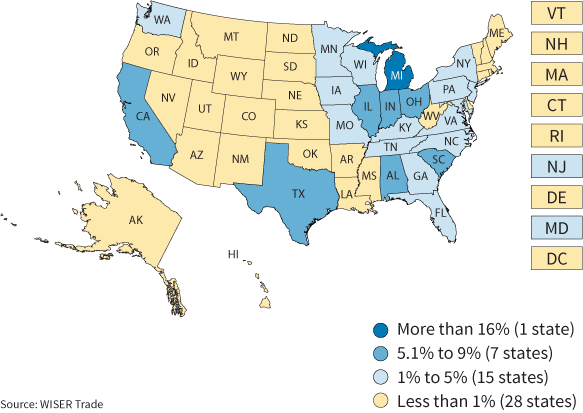
Figure 26: Leading States in the Export Industry of Vehicles and Parts (Excluding Railway)
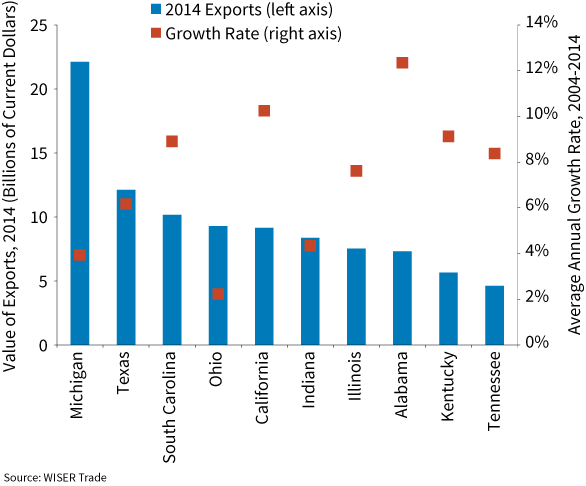
All of the top 10 vehicle and parts exporting states had positive growth rates in the past decade, with Alabama and California leading the pack at 12.3 percent and 10.2 percent, respectively. Indiana’s export value (approximately $8.4 billion) is on par with Ohio, California, Alabama and Illinois.
Figure 27: Leading States in Export of Motor Vehicle Parts and Accessories
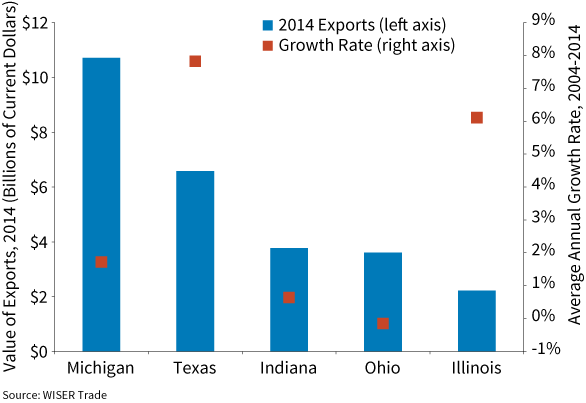
Indiana’s top exported commodity or product within the broadly defined vehicles and parts industry was motor vehicle parts and accessories. Michigan was the leader in terms of sales volume of this commodity ($10.7 billion) followed by Texas ($6.6 billion).
Pharmaceuticals
For the country as a whole, pharmaceutical products were the 9th largest exported commodity; however, in Indiana, it’s the second-highest-valued exported commodity. Indiana has been the top exporting state in pharmaceuticals since 2009.
Indiana’s 18.1 percent average annual growth rate surpassed all other top 10 exporting states except Delaware, explaining its growing share of the nation’s exports in this category.
Figure 28: Leading States in the Export of Pharmaceuticals
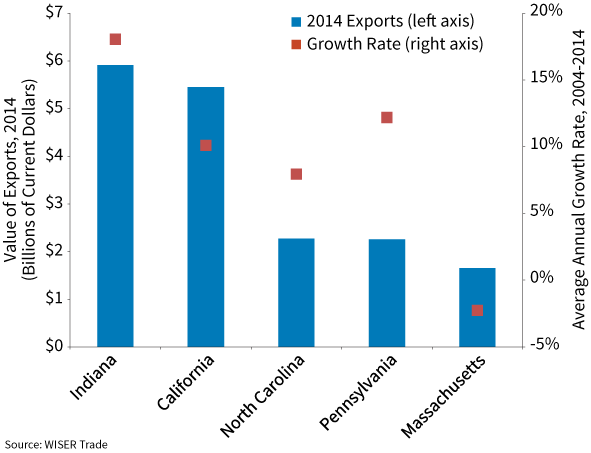
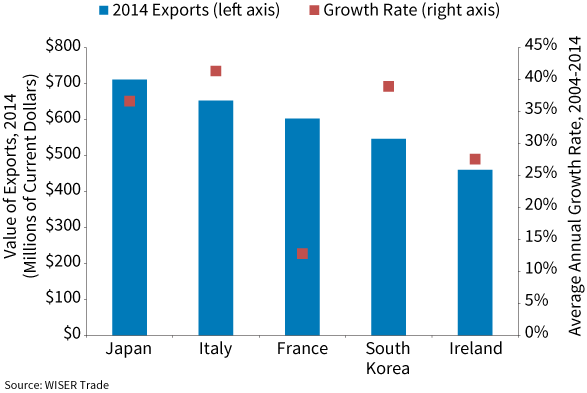
Figure 29 presents the top five export destinations for Indiana’s pharmaceuticals in 2014. Japan imported the most from Indiana at the country level, but as may be expected, Europe is a far larger market when taken as a whole.
Figure 29: Indiana's Top Five Export Destinations for Pharmaceutical Products
Industrial Machinery
Figure 30: Leading States in the Export of Industrial Machinery
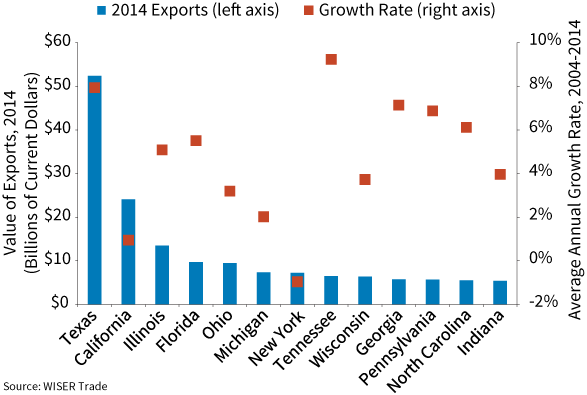
Among the states, Indiana ranked 13th in industrial machinery exports in 2014, the same spot as last year. Texas and California continue to dominate the market. In 2014, Indiana’s export of industrial machinery was worth $5.4 billion and had experienced a 4.0 percent average annual rate of growth.
Figure 31: Indiana's Top Five Export Destinations for Industrial Machinery
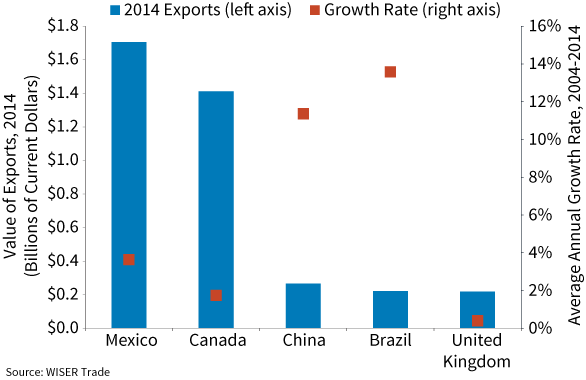
Mexico and Canada are clearly Indiana’s primary export markets for industrial machinery.
Optical and Medical Instruments
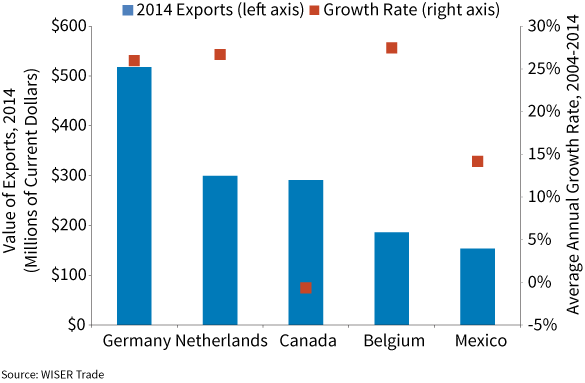
Except for 2011, optical and medical instrument exports to Germany have grown quickly, with an average annual growth rate of 26.0 percent in the past decade. The Netherlands and Belgium both had growth over 25 percent in the past decade.
Figure 32: Indiana's Top Five Export Destinations for Optical and Medical Instruments
Electrical Machinery
Indiana’s electrical machinery industry again saw strong growth in 2014. Canada dominates the Indiana export landscape for this industry.
Figure 33: Indiana's Top Five Export Destinations for Electrical Machinery
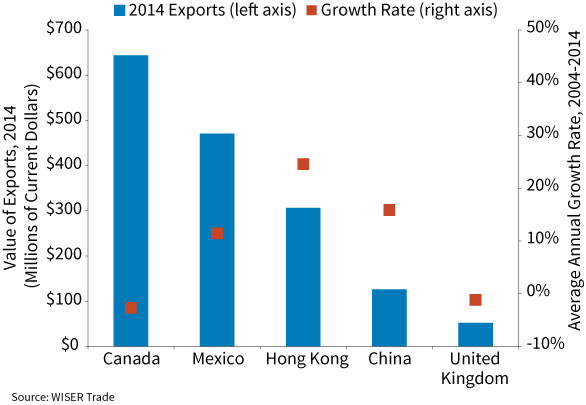
Plastics and Related Products
Figure 34: Indiana's Top Five Export Destinations for Plastics and Related Products
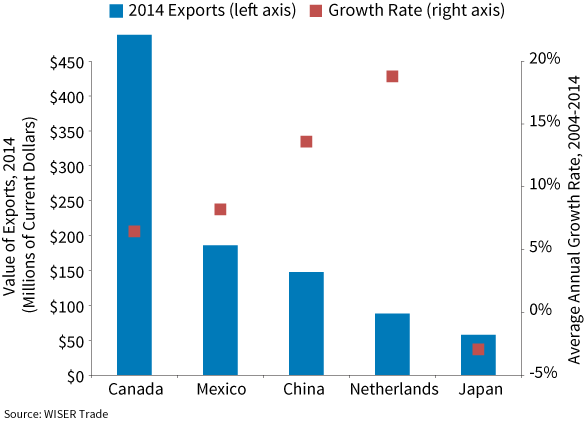
Since 2004, Indiana exports of the plastics industry has expanded steadily, at an average annual rate of 5.6 percent. Canada is by far the leading market, capturing 33.6 percent of Indiana’s plastic exports.
The Remaining Top 10 Exported Industries
Figure 35: Top Five Destination Countries of Indiana’s Remaining Top 10 Export Industries
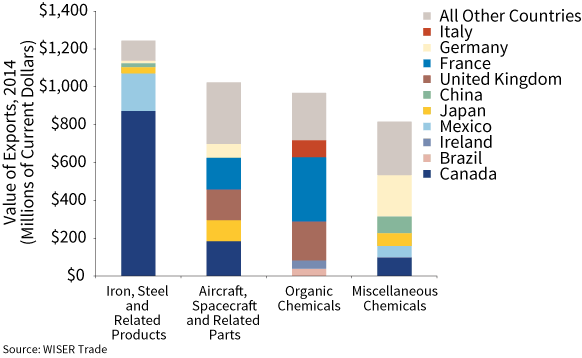
Within the iron, steel and related products industry, Canada and Mexico remained the top two importers, with Canada purchasing 70.2 percent of Indiana’s exports and Mexico purchasing 15.9 percent.
Within the aircraft, spacecraft and related parts industry, Canada was the leading importer with France close behind. Together these two countries were responsible for more than a third of all imports within the aircraft, spacecraft and related products industry.
Growth in the organic chemicals category has declined by 10 percent (at an annual average rate) since 2004. France is Indiana’s largest trading customer in this category, purchasing $338.7 million in organic chemicals in 2014. The United Kingdom fell to second place in 2014 while importing $206.9 million, despite increasing trade by $20.5 million from 2013.
Indiana exports of miscellaneous chemical products are growing slowly when compared to other top 10 industries, recording a 9.4 percent average annual growth rate since 2004. However, this represents a positive growth compared to the decline in organic chemicals.
Agriculture
Agricultural products also make a substantial contribution to the state’s exports. Unfortunately, due to the homogeneous nature of agricultural commodities, it’s nearly impossible to trace an individual agricultural product to its particular provenance, or, for that matter, determine the commodity’s foreign destination. However, the U.S. Department of Agriculture (USDA) uses U.S. farm cash-receipts data to allocate export shares by state.
Figure 36 : Indiana’s Largest Agricultural Exports
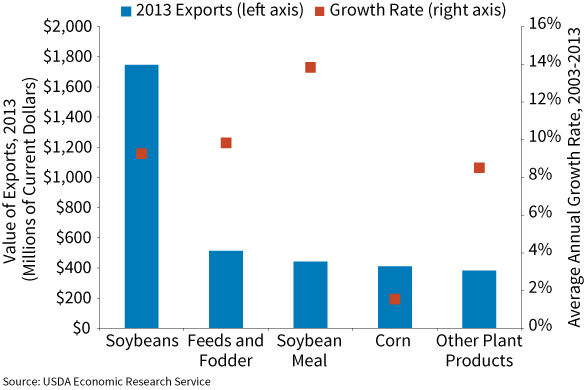
In 2013 (the most recent year available), Indiana exported $4.8 billion in agricultural products, ranking it eighth among all states. In Indiana, soybeans remained the top agricultural exported commodity at $1.75 billion, followed by feeds and fodder at $514 million. Together these two commodities accounted for nearly half of the state’s agricultural exports.
Table 7 : Share of U.S Corn and Soybean Exports, 2013
| Corn Exports (in millions) | Share of U.S. | Soybean Exports (in millions) | Share of U.S. | |
|---|---|---|---|---|
| Illinois | 802.8 | 12.6% | 3,068.6 | 14.2% |
| Indiana | 409.6 | 6.4% | 1,746.0 | 8.1% |
| Iowa | 1,116.5 | 17.5% | 2,712.3 | 12.6% |
| Minnesota | 828.7 | 13.0% | 1,762.4 | 8.2% |
| Nebraska | 765.7 | 12.0% | 1,625.1 | 7.5% |
Source: USDA Economic Research Service
Iowa and Illinois were the top two exporters of corn and soybeans in 2013, while Indiana ranked fifth in corn and fourth in soybeans.
Note: This analysis covers the most recent export data as of August 2015 from WISER Trade, the Organization for Economic Cooperation and Development, the Federal Reserve and the U.S. Department of Agriculture. The most current year varies by data source.
