Capturing the Flag, 2015
Foreign Direct Investment in Indiana
Click on a tab below to learn more about the impact of foreign direct investment on Indiana's economy.
Key Findings

In 2012,* nearly 5.8 million U.S. workers were employed by majority-owned U.S. affiliate (MOUSA) enterprises, with 152,700 of these workers in Indiana. Indiana ranked 14th in the nation in MOUSA employment.
Since 2010, all Midwestern states made gains in MOUSA employment. Indiana added 12 percent more MOUSA employees in this three-year period.

4.8 percent of Indiana private employment was in MOUSAs in 2012, a 20 percent decrease from the year before. The manufacturing industry captured the largest share of MOUSA employment nationally—37.7 percent. In Indiana, 64.1 percent of MOUSA employment was in manufacturing. The 97,900 manufacturing jobs accounted for 3.1 percent of the state’s private employment.

Between 2012 and 2014,* there were 4,460 FDI announcements for the U.S. as a whole, valued at $145 billion with almost 400,000 anticipated jobs. Indiana had 127 FDI announcements valued at $4.6 billion. These investments were projected to create nearly 13,300 jobs, or around 4,400 new jobs on an annual basis.

The automobile and components industries captured the largest share of Indiana’s expected FDI jobs with almost 7,000 new positions—about 52 percent of the total anticipated FDI jobs announced between 2012 and 2014. This averaged over 2,300 new jobs in manufacturing per year.

Manufacturing remained the most popular business activity for foreign investment in Indiana. Almost 74 percent of all announced new jobs were manufacturing related in the Hoosier state, whereas new FDI jobs in manufacturing averaged 37 percent nationally.
Global FDI Environment
The United States ranked 26th among the 58 countries in the OECD’s 2014 Regulatory Restrictiveness Index, which measures each country’s openness to foreign direct investment.
Figure 1: Regulatory Restrictiveness Index of OECD Countries, 2014

FDI Inflow
Slightly more than half of FDI activity in 2013* was concentrated in developing economies, whereas advanced economies made up 39 percent of all FDI inflows, and transitioning economies accounted for 7 percent.
Figure 2: FDI Inflows as a Percent of World Inflows, 2013

In 2013, all countries saw an increase in FDI inflow as a percent of GDP, with transitioning countries seeing the most drastic change. The United States’ FDI inflow increased a little from 0.98 percent of GDP in 2012 to 1.1 percent in 2013.
Figure 3: FDI Inflows as a Percentage of GDP

FDI Outflow
In 2013, advanced economies accounted for 61 percent of total FDI outflows, compared to 32 percent and 7 percent from developing and transitioning economies, respectively. This is a reduced proportion from last year, when advanced economies accounted for 79 percent of total FDI outflows.
Figure 4: FDI Outflows as a Percent of World Outflows, 2013

During 2013, transitioning economies had an increase in FDI outflows as a percent of GDP, while advanced and developing economies remained fairly steady. FDI outflows from the U.S. declined slightly from 2.5 percent in 2012 to 2.0 percent in 2013. However, FDI outflows from the U.S. were still slightly higher than world FDI outflows, which were 1.9 percent of GDP.
Figure 5: FDI Outflows as a Percentage of GDP

FDI Activity in the United States, Midwest and Indiana
Figure 6: U.S. Inward and Outward Foreign Direct Investment Stock
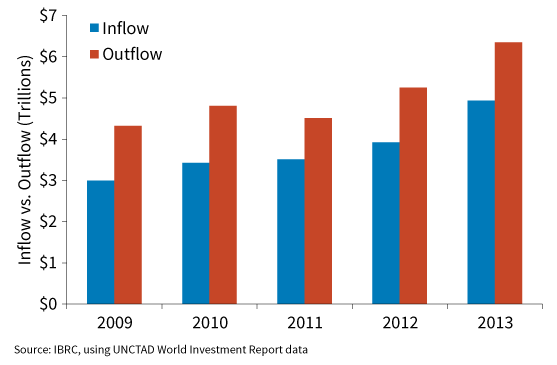
Historically, the United States’ FDI outflow stock has outpaced inflow stock, a trend that continued in 2013.*
Compared to 2012, 2013 saw an increase in both FDI outflow and FDI inflow stock, valued at $6.3 trillion and $4.9 trillion, respectively.
Mergers and Acquisitions
In 2013, the value of mergers and acquisitions (M&As) increased by 5 percent to $348 billion from $331 billion in 2012. The services sector accounted for 65 percent of the total value of cross-border M&As in 2013, compared to 57 percent in 2012. Mining, quarrying and petroleum also saw a decrease in proportion of total M&As in 2013, while the manufacturing sector saw an increase.
Figure 7: World FDI Resulting from Mergers and Acquisitions by Sector, 2013
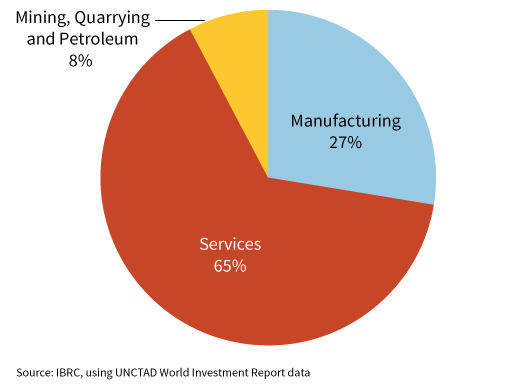
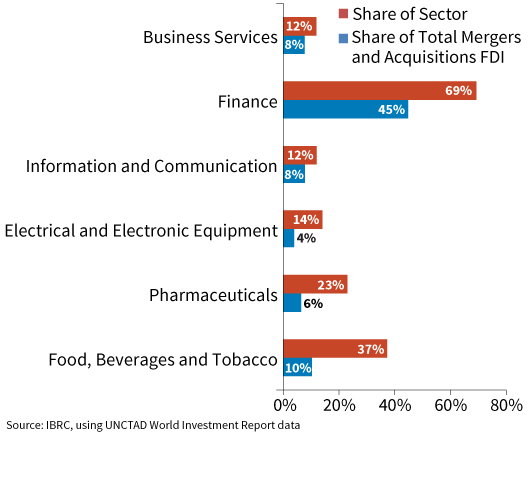
Within the services sector, financial services were responsible for more than two-thirds of the value of cross-border M&As (69 percent), followed by business services and information and communication (12 percent each). Food, beverages, and tobacco accounted for over a third of the value of total manufacturing M&As, followed by pharmaceuticals (23 percent) and electrical and electronic equipment manufacturing (14 percent).
Figure 8: Mergers and Acquisitions in the Top Three Industries within the Services and Manufacturing Sectors, 2013
Employment
Table 1: MOUSA Employment in Midwestern States, 2012
| U.S. Rank | Geography | MOUSA Employment (in thousands) |
Change since 2010 |
|---|---|---|---|
| n/a | United States | 5,771.2 | 6% |
| 5 | Illinois | 272.8 | 8% |
| 8 | Ohio | 224.0 | 7% |
| 12 | Michigan | 187.6 | 29% |
| 14 | Indiana | 152.7 | 12% |
| 15 | Tennessee | 125.7 | 7% |
| 19 | Minnesota | 97.9 | 8% |
| 21 | Kentucky | 95.4 | 7% |
| 22 | Missouri | 89.6 | 10% |
| 24 | Wisconsin | 85.6 | 10% |
| 29 | Iowa | 51.2 | 14% |
Source: IBRC, using U.S. Bureau of Economic Analysis data
Between 2010 and 2012,* the U.S. and all Midwestern states experienced an increase in MOUSA employment.
Indiana saw the third-largest increase in MOUSA employment (12 percent) of the Midwestern states, following Michigan (29 percent) and Iowa (14 percent).
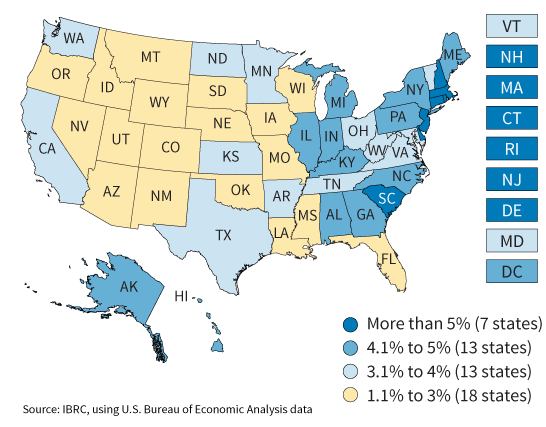
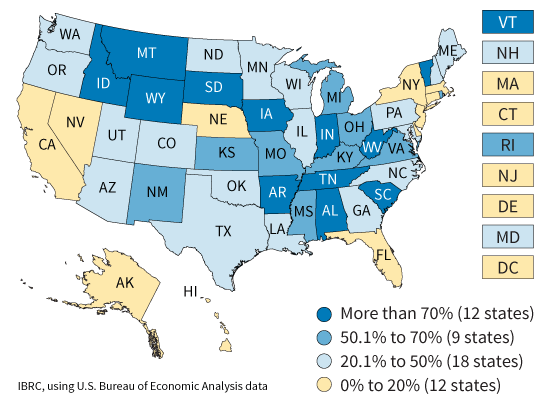
In 2012, 4.8 percent of Indiana’s total private sector employment worked in MOUSA firms, the largest percentage among Midwestern states.
Figure 9: MOUSA Employment as Percent of Total Private Employment, 2012
All states except Connecticut, Delaware and New Hampshire saw an increase in MOUSA employment from 2010 to 2012.
Figure 10: Percent Change in MOUSA Employment, 2010 to 2012
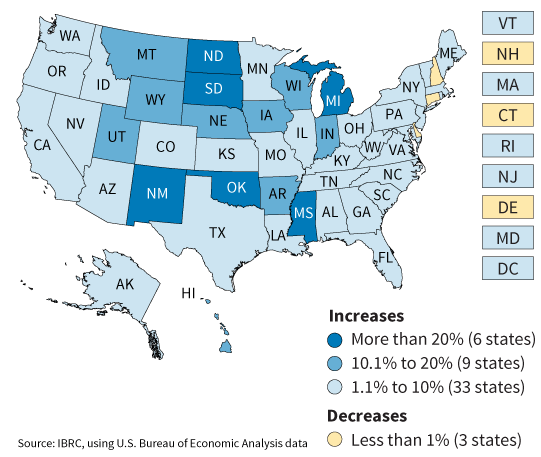
Figure 11: MOUSA Employment Trends in the Midwest
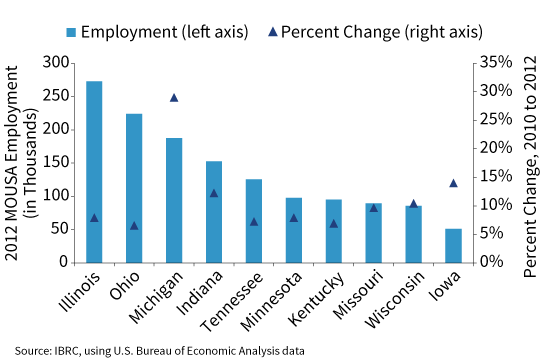
Within the Midwest, Michigan and Iowa saw the largest percent change in MOUSA employment from 2010 to 2012.
Indiana saw an increase of 12 percent in MOUSA employment, to reach just over 150,000 employees.
Figure 12: Top Three Sources of MOUSA Employment for Midwestern States, 2012
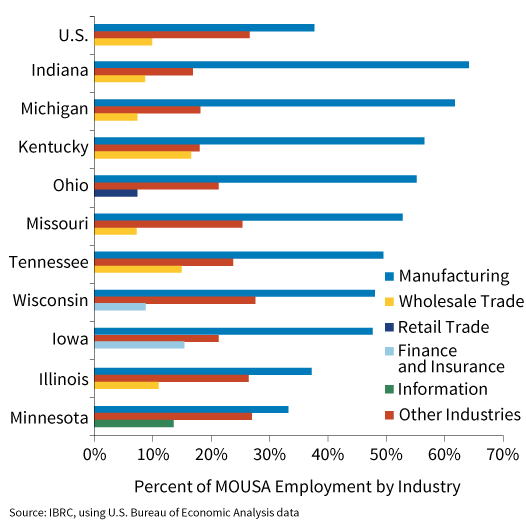
In the United States, manufacturing accounted for 38 percent of total MOUSA employment. This proportion was higher for all Midwestern states, with Indiana leading at 64 percent.
The second-highest source of MOUSA employment in both the United States and Indiana was the “other industries” category, followed by wholesale trade.
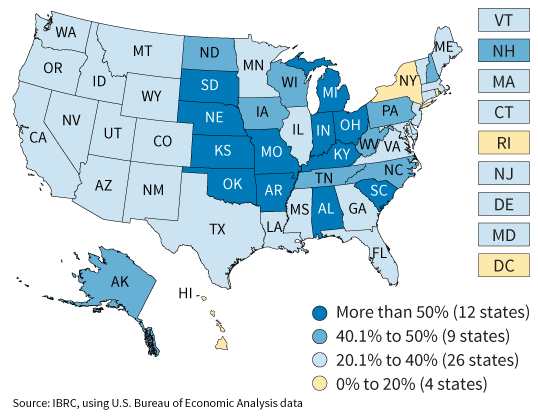
In 2012, Indiana had 152,700 MOUSA jobs, of which 97,900 were in manufacturing. In the United States, only Arkansas had a higher percentage of MOUSA jobs in manufacturing than Indiana.
Figure 13: MOUSA Manufacturing Employment as a Percentage of MOUSA Employment, 2012
MOUSA manufacturing employment accounts for 20 percent of Indiana’s total private manufacturing employment. This is higher than the national average of 17 percent, and the third-highest percent among the Midwestern states.
Figure 14: MOUSA Manufacturing Employment as a Percent of Total Private Manufacturing Employment, 2012
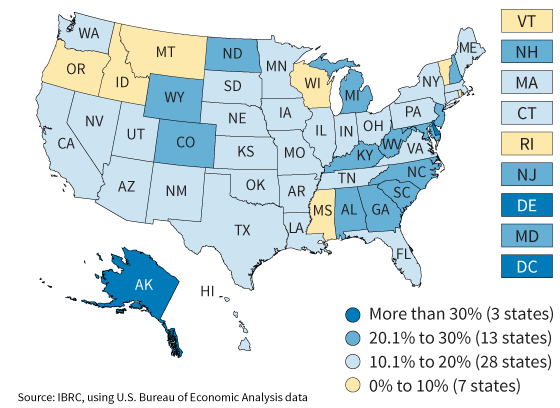
Figure 15: Share of Manufacturing Jobs of All MOUSA Employment in the Midwest, 2012
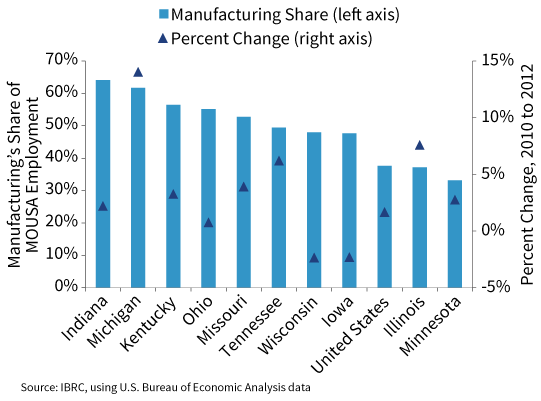
All Midwestern states except for Wisconsin and Iowa experienced an increase in the proportion of MOUSA employment in manufacturing. Among Midwestern states, Indiana continued to have the highest share of MOUSA employment in manufacturing at 64 percent. Since 2010, MOUSA manufacturing jobs have increased 2 percent in Indiana.
Foreign-owned businesses in Indiana represented 4.8 percent of the state’s total private industry employment in 2012. Indiana’s share was greater than the nation as a whole (3.7 percent) and all other Midwestern states.
Table 2: Employment of MOUSAs by Sector of Affiliate and Percentage of Private Sector, 2012
| Geography | Indicator | All Industries | Manufacturing | Wholesale Trade | Retail Trade | Information | Finance and Insurance | Real Estate and Rental and Leasing | Professional, Scientific, and Technical Services | Other Industries |
|---|---|---|---|---|---|---|---|---|---|---|
| United States | Jobs | 5,771.2 | 2,173.8 | 570.1 | 518.3 | 239.0 | 390.3 | 50.0 | 294.8 | 1,535.0 |
| % of Jobs | 3.7% | 17.2% | 9.1% | 2.9% | 7.4% | 4.0% | 0.6% | 2.4% | 1.8% | |
| Illinois | Jobs | 272.8 | 101.4 | 30.1 | 15.7 | 10.4 | 20.8 | 1.4 | 20.9 | 72.0 |
| % of Jobs | 4.2% | 16.8% | 9.6% | 2.2% | 8.7% | 4.2% | 0.5% | 4.0% | 2.0% | |
| Indiana | Jobs | 152.7 | 97.9 | 13.3 | 6.1 | 5.8 | 1.5 | 0.2 | 2.1 | 25.8 |
| % of Jobs | 4.8% | 19.7% | 10.6% | 1.6% | 13.3% | 1.0% | 0.2% | 1.3% | 1.5% | |
| Iowa | Jobs | 51.2 | 24.4 | 2.8 | 1.3 | 2.9 | 7.9 | 0.1 | 1.0 | 10.9 |
| % of Jobs | 3.0% | 11.2% | 3.8% | 0.6% | 9.3% | 6.1% | 0.2% | 1.4% | 1.2% | |
| Kentucky | Jobs | 95.4 | 53.9 | 15.8 | 2.7 | 2.4 | 1.5 | 0.3 | 1.7 | 17.2 |
| % of Jobs | 4.7% | 23.4% | 20.1% | 1.1% | 7.7% | 1.5% | 0.4% | 1.6% | 1.5% | |
| Michigan | Jobs | 187.6 | 115.8 | 13.8 | 5.1 | 5.3 | 4.7 | 0.3 | 8.6 | 34.1 |
| % of Jobs | 4.1% | 20.6% | 7.9% | 0.9% | 7.6% | 2.0% | 0.2% | 2.4% | 1.4% | |
| Minnesota | Jobs | 97.9 | 32.5 | 9.2 | 4.1 | 13.3 | 6.8 | 0.7 | 4.8 | 26.4 |
| % of Jobs | 3.2% | 10.2% | 6.6% | 1.2% | 21.5% | 3.2% | 0.6% | 2.3% | 1.6% | |
| Missouri | Jobs | 89.6 | 47.3 | 6.5 | 3.8 | 3.0 | 2.5 | 0.1 | 3.7 | 22.7 |
| % of Jobs | 2.9% | 18.1% | 5.1% | 1.0% | 4.9% | 1.3% | 0.1% | 1.9% | 1.3% | |
| Ohio | Jobs | 224.0 | 123.6 | 14.4 | 16.5 | 6.0 | 5.9 | 0.6 | 9.3 | 47.7 |
| % of Jobs | 3.9% | 18.1% | 5.9% | 2.4% | 6.7% | 1.8% | 0.3% | 2.5% | 1.5% | |
| Tennessee | Jobs | 125.7 | 62.2 | 18.8 | 5.6 | 3.0 | 2.5 | 0.2 | 3.4 | 29.9 |
| % of Jobs | 3.9% | 19.0% | 14.2% | 1.4% | 5.6% | 1.5% | 0.1% | 1.8% | 1.6% | |
| Wisconsin | Jobs | 85.6 | 41.1 | 6.0 | 3.5 | 2.3 | 7.5 | 0.1 | 1.4 | 23.6 |
| % of Jobs | 2.8% | 8.7% | 4.7% | 1.0% | 4.3% | 4.0% | 0.1% | 0.9% | 1.5% | |
| Total Midwest Jobs | 623.0 | 307.4 | 55.3 | 33.6 | 28.0 | 25.3 | 1.7 | 22.7 | 150.4 | |
Note: Jobs are shown in thousands.
Source: IBRC, using U.S. Bureau of Economic Analysis data
FDI Announcements, 2012 to 2014
Announcements in the U.S., Midwest and Indiana
Table 3: Foreign Direct Investment by Region, 2012 to 2014
| Region | Total Deals | Foreign Deals | Value (in millions) | Anticipated Jobs |
|---|---|---|---|---|
| U.S.* | 14,406 | 4,460 | $145,318 | 398,674 |
| Midwest* | 3,137 | 885 | $28,093 | 97,099 |
| Illinois | 520 | 159 | $4,667 | 15,408 |
| Indiana* | 455 | 127 | $4,630 | 13,280 |
| Iowa | 105 | 18 | $1,666 | 977 |
| Kentucky | 253 | 78 | $2,364 | 8,431 |
| Michigan | 358 | 150 | $4,257 | 20,130 |
| Minnesota | 182 | 51 | $596 | 2,542 |
| Missouri | 206 | 39 | $1,246 | 3,859 |
| Ohio | 481 | 127 | $3,368 | 12,618 |
| Tennessee | 417 | 110 | $4,670 | 16,343 |
| Wisconsin | 160 | 26 | $628 | 3,511 |
*Indiana's data have been verified, whereas other states' data represent unverified fDi Markets reported figures.
Source: IBRC, using fDi Markets data
Nationally, 14,406 projects were announced between 2012 and 2014,* and 31 percent of those were made by foreign-based companies.
Within the Midwest and Indiana, approximately 28 percent of proposed projects were made by foreign companies, totaling 885 projects in the Midwest and 127 projects in Indiana.
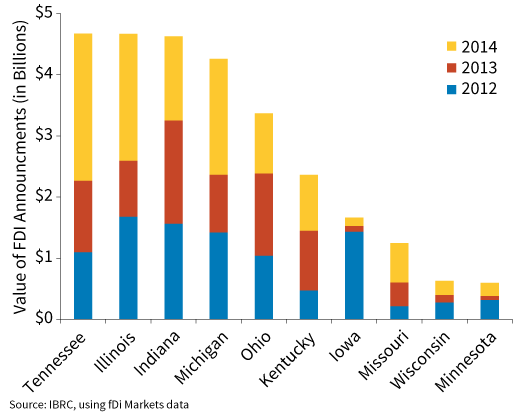
Indiana is among the top three Midwestern states in terms of expected dollar value of FDI announcements. Over the last three years, Indiana’s capital investment related to FDI remained fairly constant. In contrast, Iowa has seen a sharp decrease, while Missouri has seen an increase.
Figure 16: Expected Value of Capital Investment
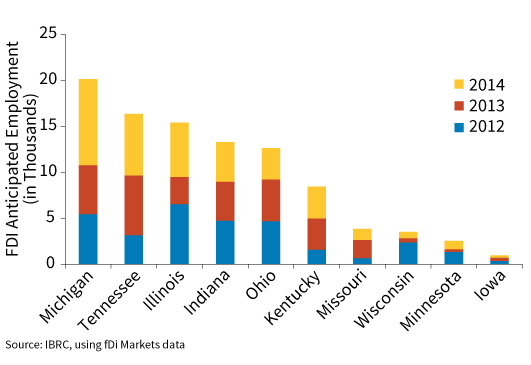
In terms of expected employment related to FDI projects from 2012 to 2014, Indiana ranked fourth among Midwestern states. From 2012 to 2014, the expected number of jobs created by FDI has remained fairly steady in Indiana, but has seen a decrease in Wisconsin and Minnesota.
Figure 17: Expected Number of Jobs Related to FDI Project Announcements
By Industry
Figure 18: FDI Project Announcement (Expected) Employment by Industry Sector, 2012 to 2014
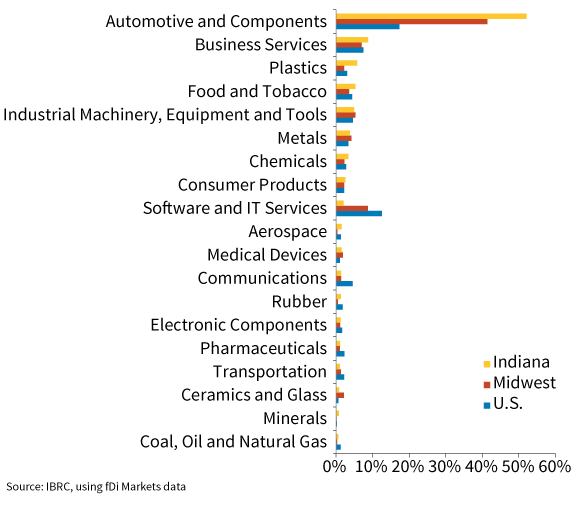
Indiana’s top FDI employment industry was automobile and components (52 percent), trailed by business services (9 percent) and plastics (6 percent).
Automobile and components dominated FDI employment nationally and in the Midwest as well, with 17 percent and 41 percent of expected jobs, respectively.
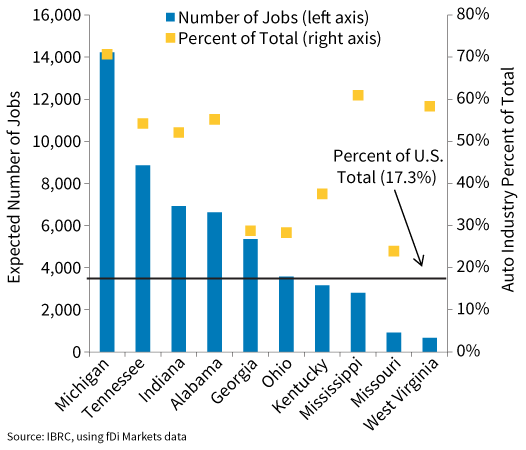
Among the top destination states for auto sector FDI, Indiana had the third-highest projection of auto-related jobs behind Michigan and Tennessee.
Figure 19: Automotive Industry FDI Employment Announcements and Share of the Total, 2012 to 2014
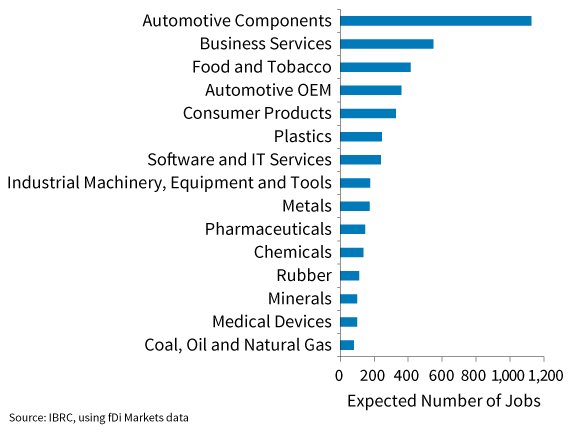
The automobile and components industry sector was the largest source of anticipated employment in Indiana.
Figure 20: Indiana FDI Employment Announcements by Industry, 2014
By Business Activity
At 76.4 percent, Indiana had the sixth-highest percentage of FDI employment announcements in manufacturing.
Figure 21: Manufacturing FDI Employment Announcements as a Share of the Total, 2012 to 2014
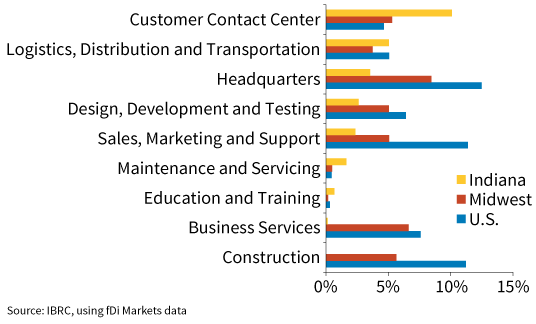
Customer contact centers had the highest share of FDI employment announcements in Indiana from 2012 to 2014, after manufacturing.
Figure 22: Non-Manufacturing FDI Employment Announcements as a Share of the Total, 2012 to 2014
By Source Country
Figure 23: Share of Total Employment Announcements by Source Country, 2012 to 2014
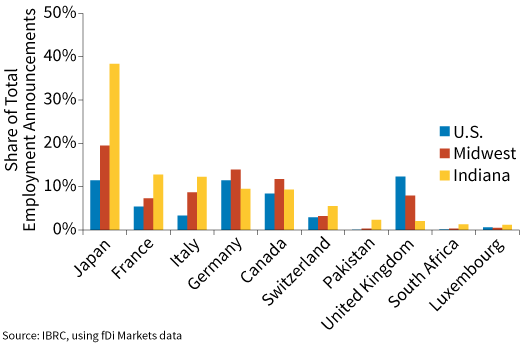
Japanese companies were the largest source (38 percent) of FDI announced employment intentions for Indiana and the Midwest between 2012 and 2014.
*Note: This analysis covers the most recent FDI data as of August 2015 from the United Nations, the Organization for Economic Cooperation and Development (OECD), the U.S. Bureau of Economic Analysis (BEA) and fDi Markets. The most current year varies by data source, ranging from 2012 for the BEA data to 2014 for fDi Markets.
