Indiana’s Projected Future: Visualizing Age Group Trends to 2050
Three visualizations present our demographic future for key age groups: under 20, the prime working ages (ages 25-54) and seniors (ages 65 and older). Use these to explore fundamental questions, such as: Will there be enough working age people to power business growth in my region? Will there be enough children to attend our schools? (And if you want an overall view of total population, check out this visualization, too).
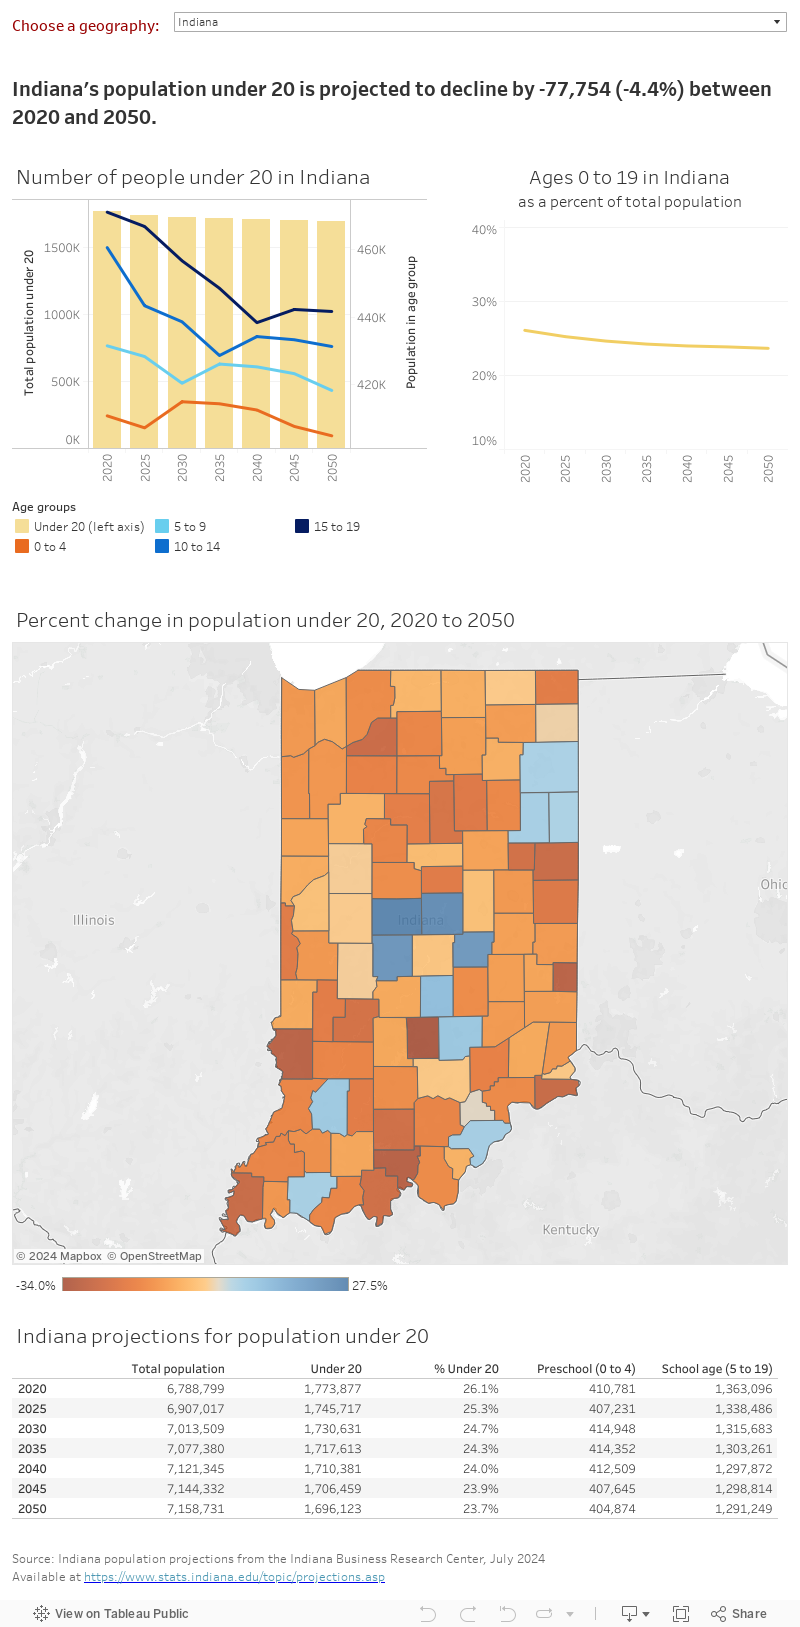
Under 20
Tracking population changes in the under 20 age group is crucial for planning educational resources and shaping future workforce development. Understanding demographic trends in this age group helps ensure adequate investment in health care, education and social services.
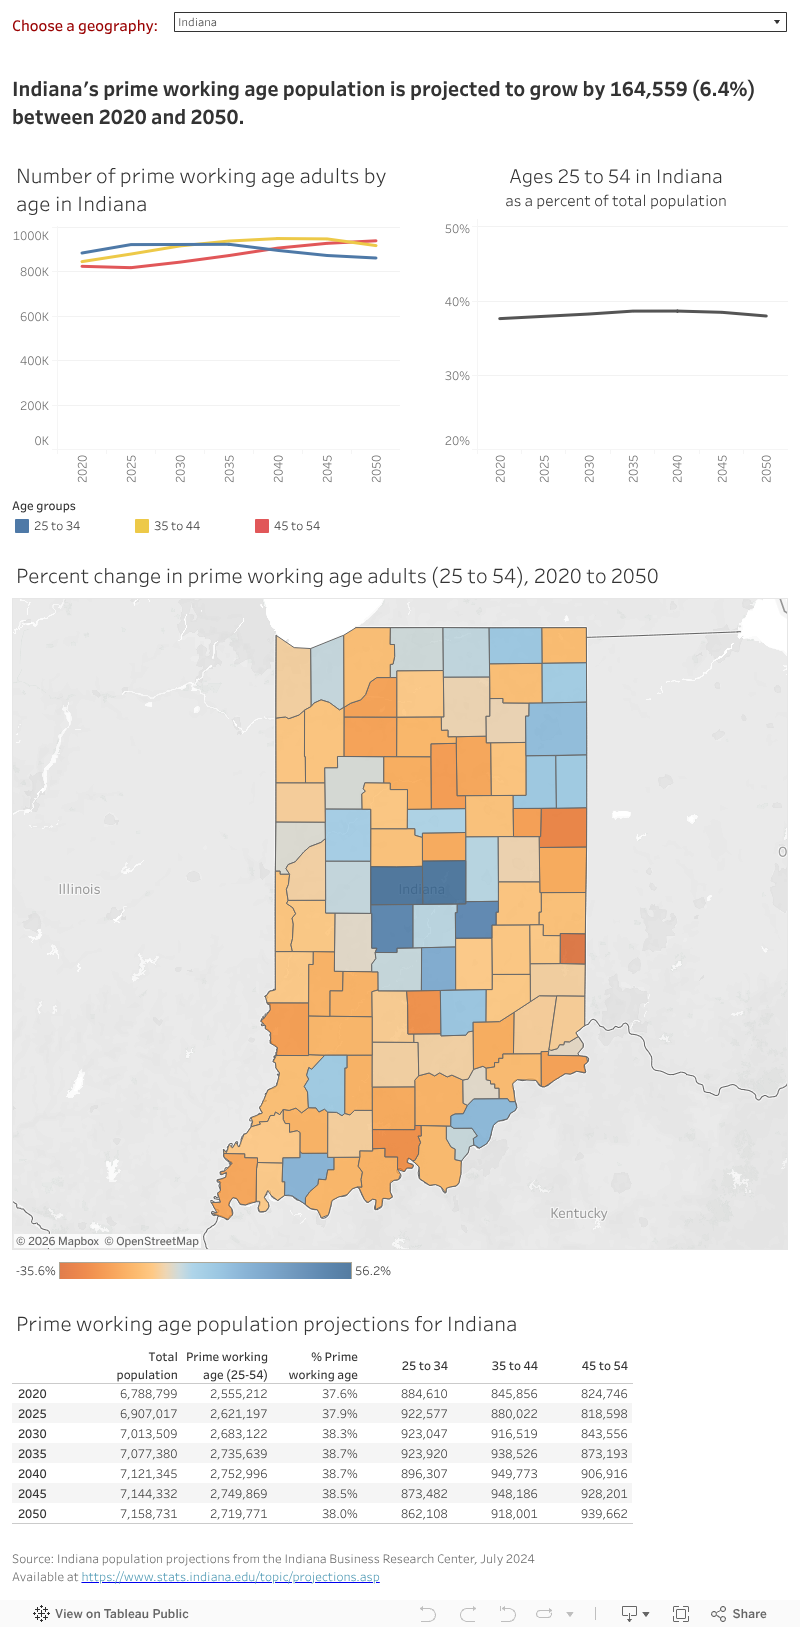
Prime Working Age (Ages 25-54)
Adults between the ages of 25 and 54 are in their prime working and household formation years. Monitoring population changes in this age group is essential for economic planning and labor market strategies. This group is the backbone of economic productivity, innovation and consumer spending. Accurate data helps businesses and policymakers create effective employment policies, workforce development programs and economic forecasts.
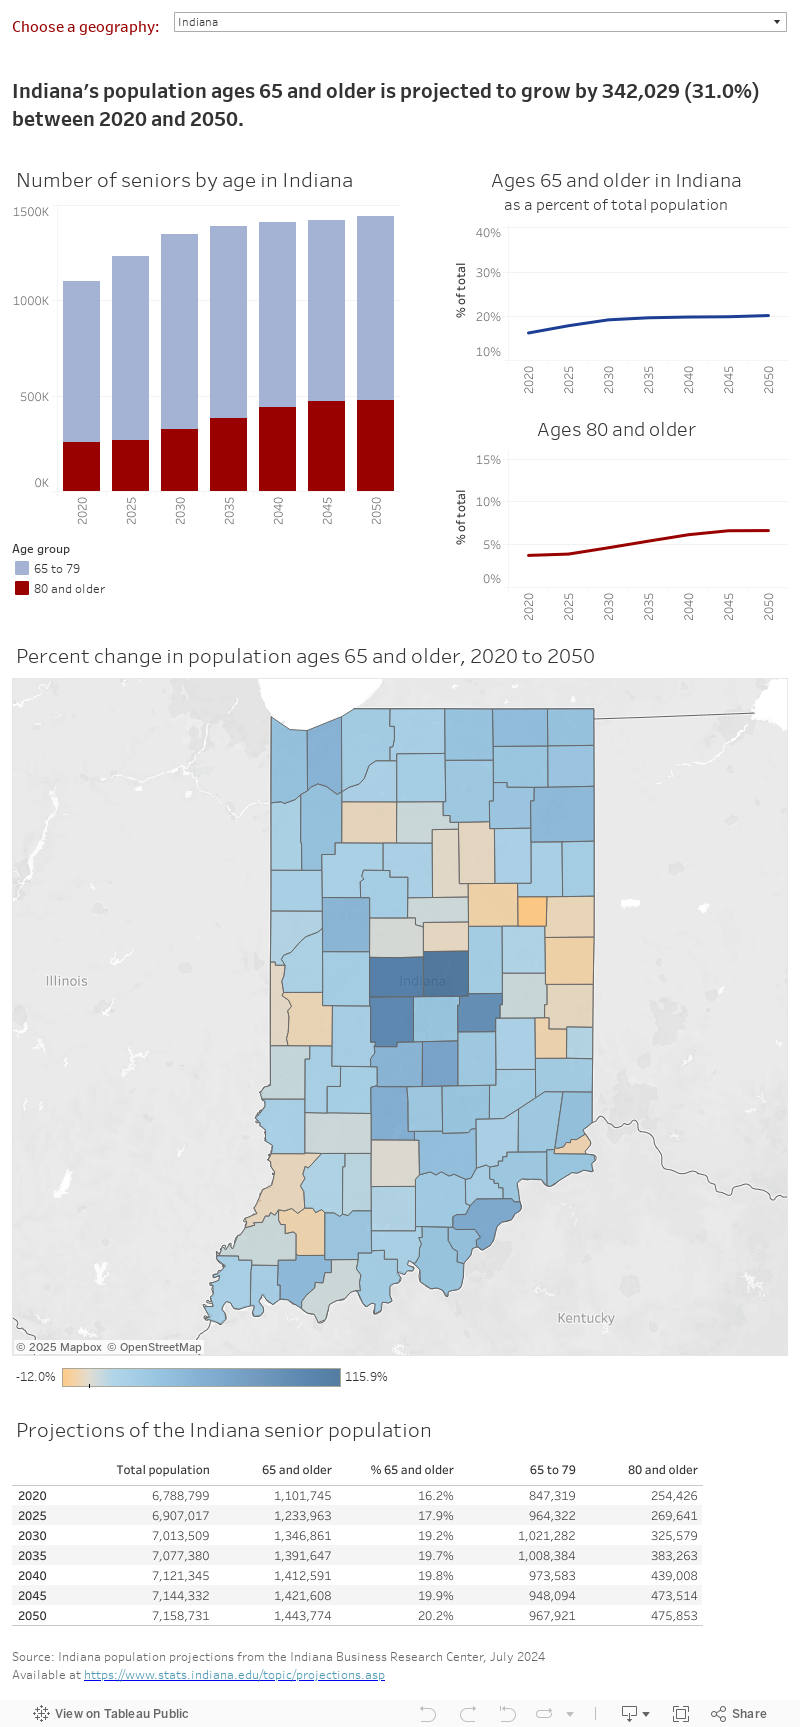
Seniors (Ages 65 and Older)
Tracking population changes among those 65 and older is vital for addressing health care, retirement and social service needs. As this age group grows, it impacts pension systems, health care infrastructure and housing markets. Understanding these trends helps ensure sustainable support systems and enhances the quality of life for aging populations.