
Thematic Map Archive
This page archives maps that are no longer current for research purposes. If you are looking for maps based on the most recent data, please visit the thematic map gallery.
Click on a category below to expand a list of available maps.
- Percent of Population with a Bachelor's Degree or Higher: Counties
- School District Population: 2010
- Public Universities in Indiana: 2006
- Indiana School Districts Offering Full-Day Kindergarten: 2011
Educational Attainment: High School
- Percent with Diploma: Age 25+
- Percent with Diploma: Age 25+: 2000
- Point Change with Diploma: 1990-2000: Age 25+
- Less than 9th Grade: 2000
- 9th-12th, No Diploma: 2000
- High School Graduate: 2000
Educational Attainment: College
- Percent with Bachelor's Degree or More: Age 25+: States
- Percent with Bachelor's Degree: 2000: Age 25+
- Number with Bachelor's Degree: 2000: U.S. Counties
- Point Change with Bachelor's: 1990-2000: Age 25+
- Some College, No Degree: 2000
- Associate's Degree: 2000
- Bachelor's Degree: 2000
- Graduate Degree: 2000
Average Annual Rate of Change in Labor Force (from the official 2010-2040 labor force projections for the State of Indiana released in November 2012)
Family Households
- Husband-Wife Households: 2010
- Unmarried Partner Households: 2010
- Family Households: 2000: Tracts
- Children Under Age 6 Living with Both Parents: 2000
- Children Age 6-17 Living with Both Parents: 2000
- Children Under Age 6 with Both Parents Working: 2000
- Children Age 6-17 with Both Parents Working: 2000
Marital Status
- Never Married: 2000
- Married: 2000
- Married with Children: 2000: Tracts
- Divorced: 2000
- Widowed: 2000
Single Mothers
- Single Mothers: 2000: Tracts
- Single Mothers Percent Change: 1990-2000
- Unemployed Single Moms with Kids Under 6: 2000
- Unemployed Single Moms with Kids 6-17: 2000
Single Fathers
Median Income
- Median Family Income: 2000
- Median Household Income: 2010
- Median Household Income: 2000
- Male-Female Median Earnings Difference: 2000
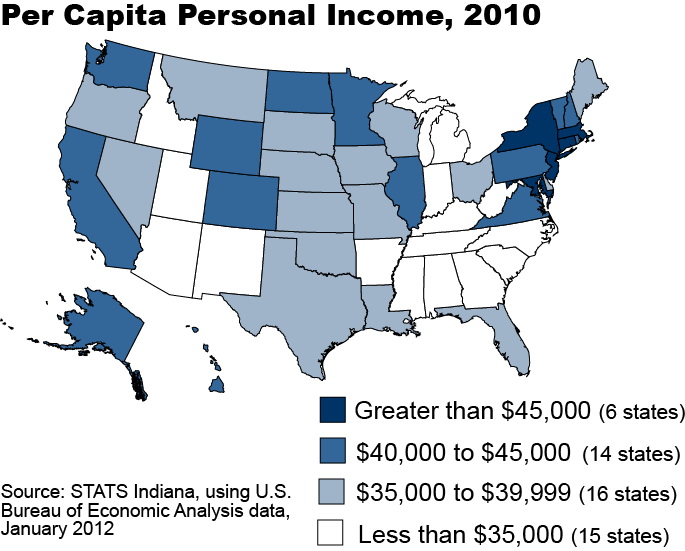
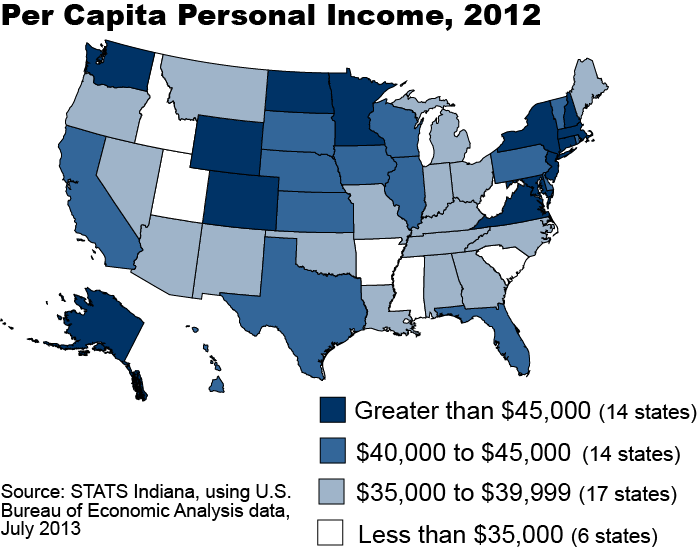
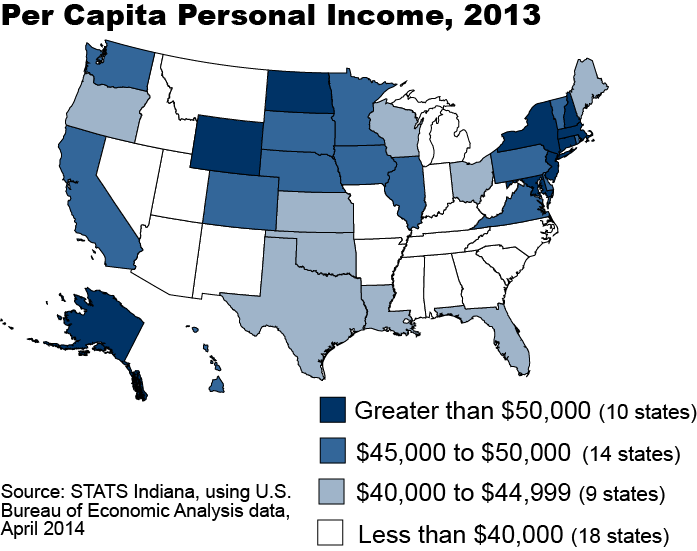
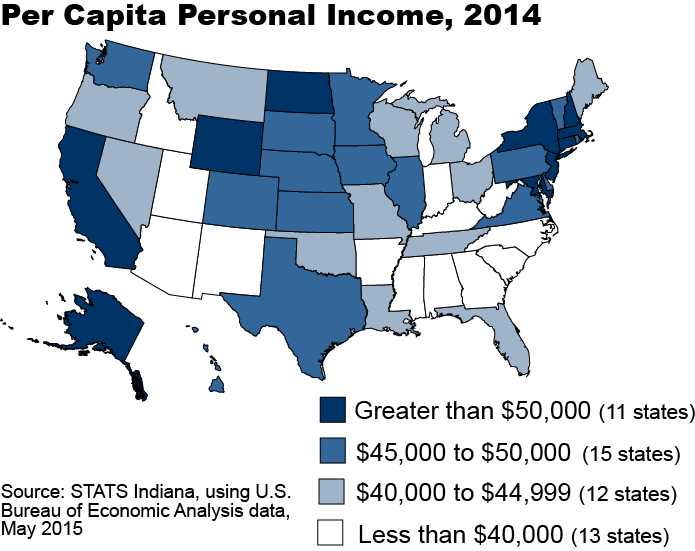
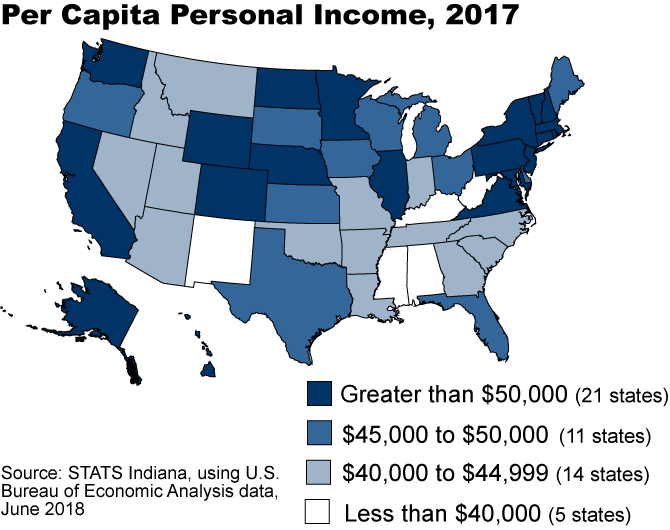
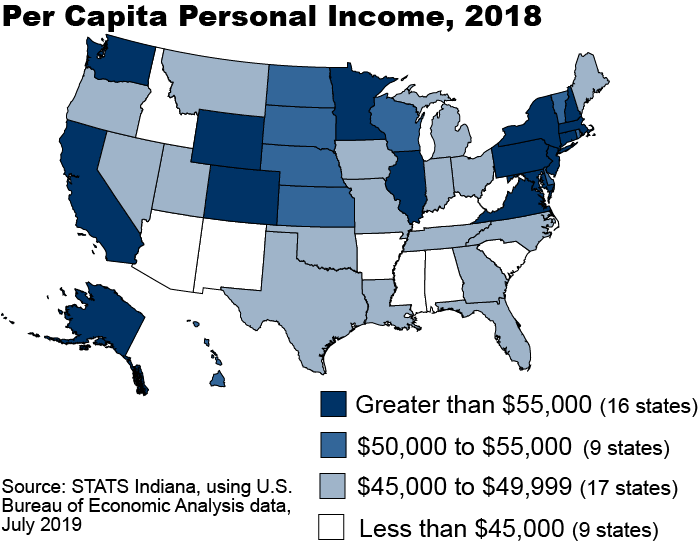
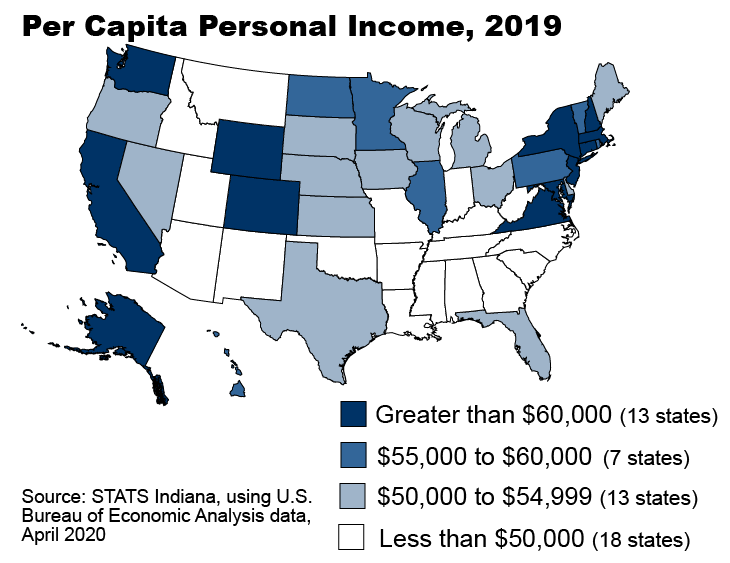
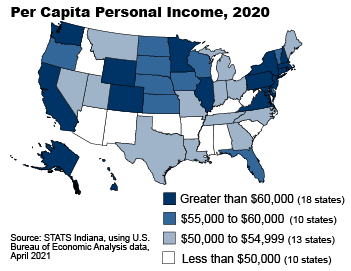
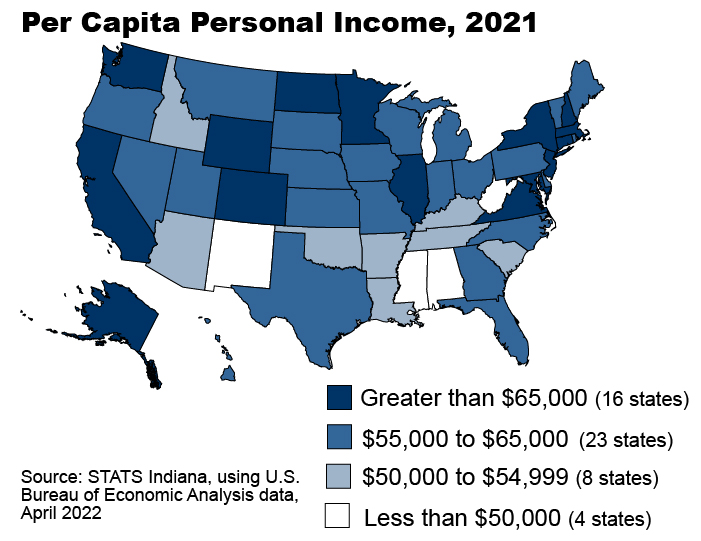
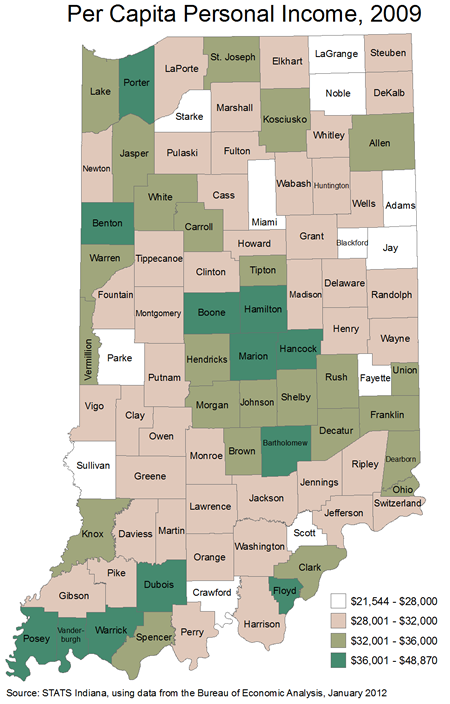
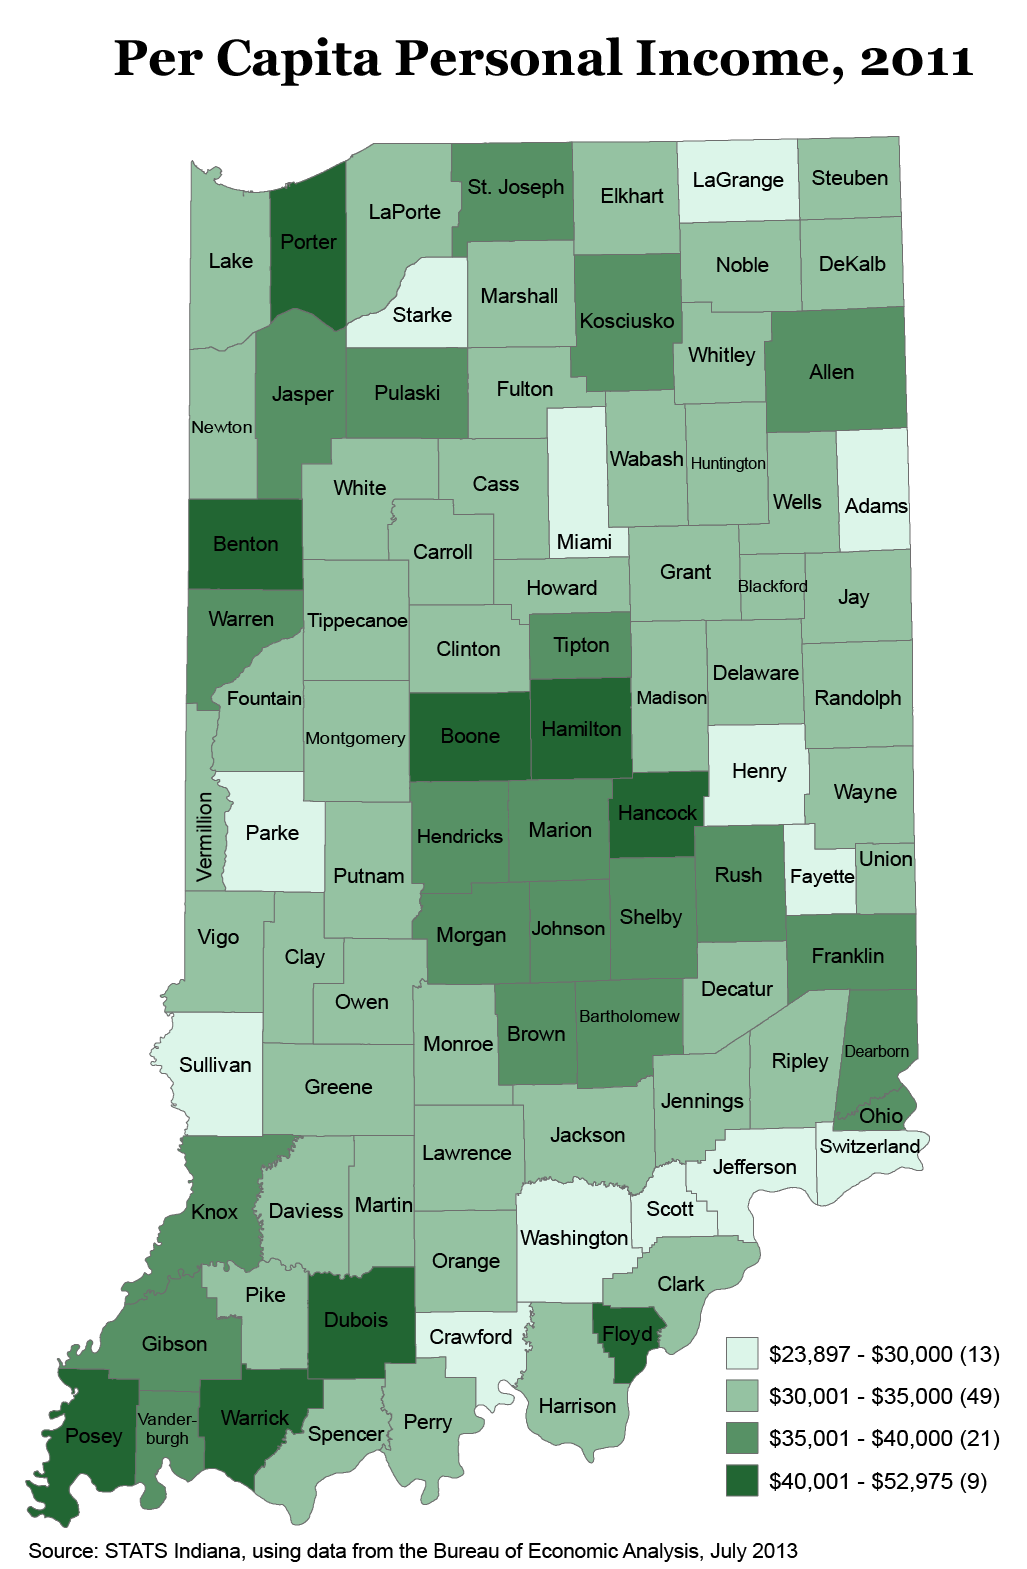
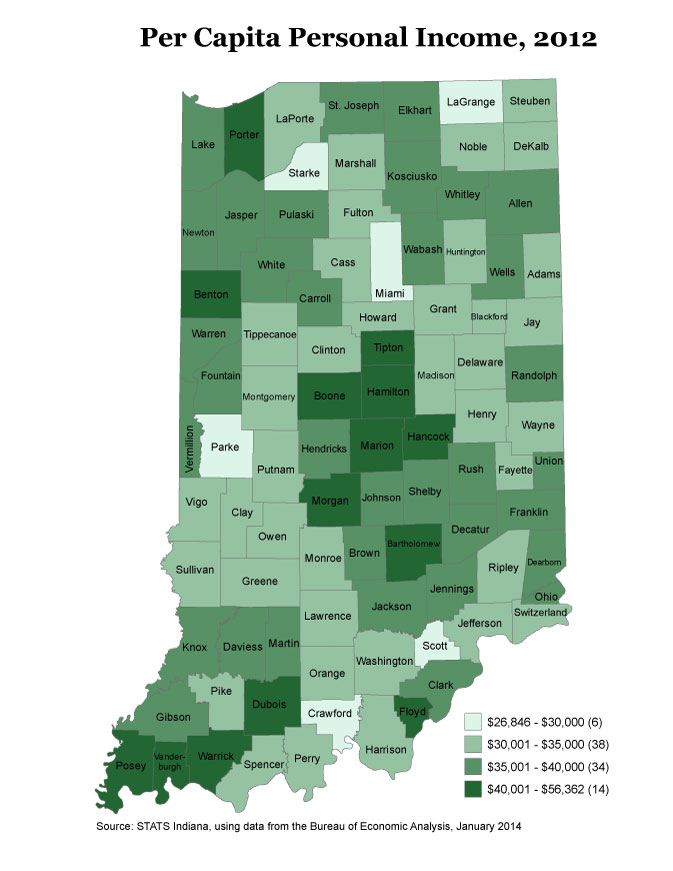
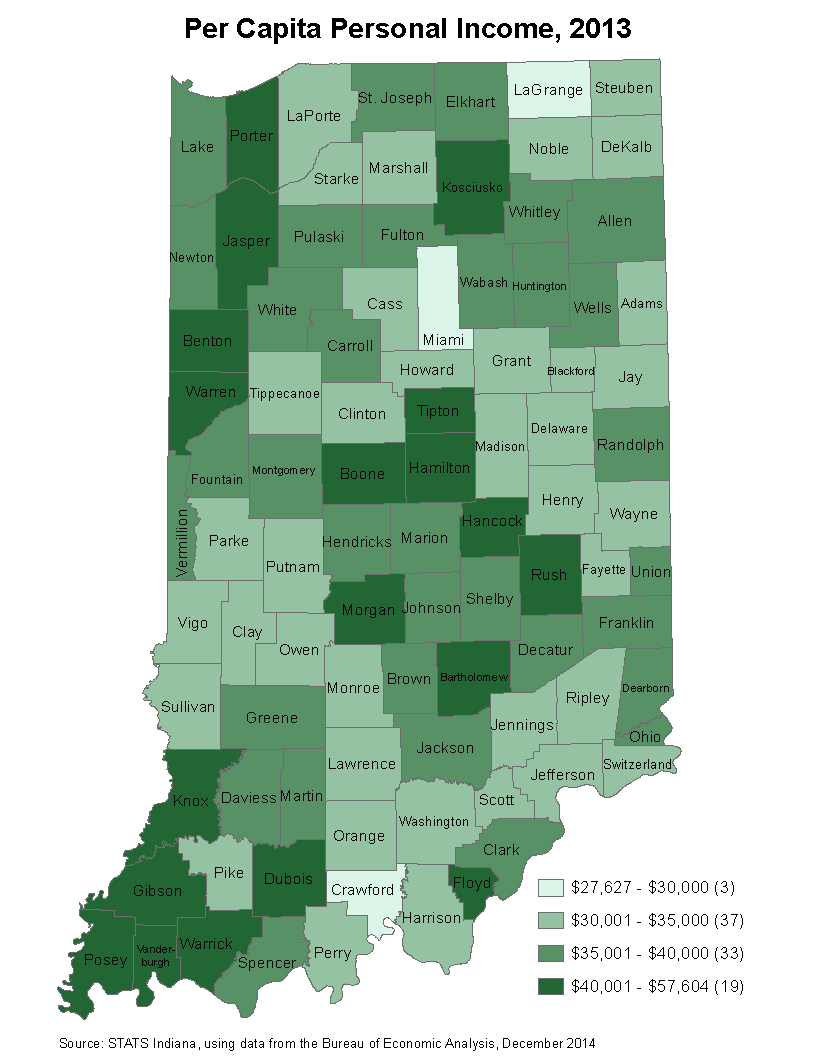
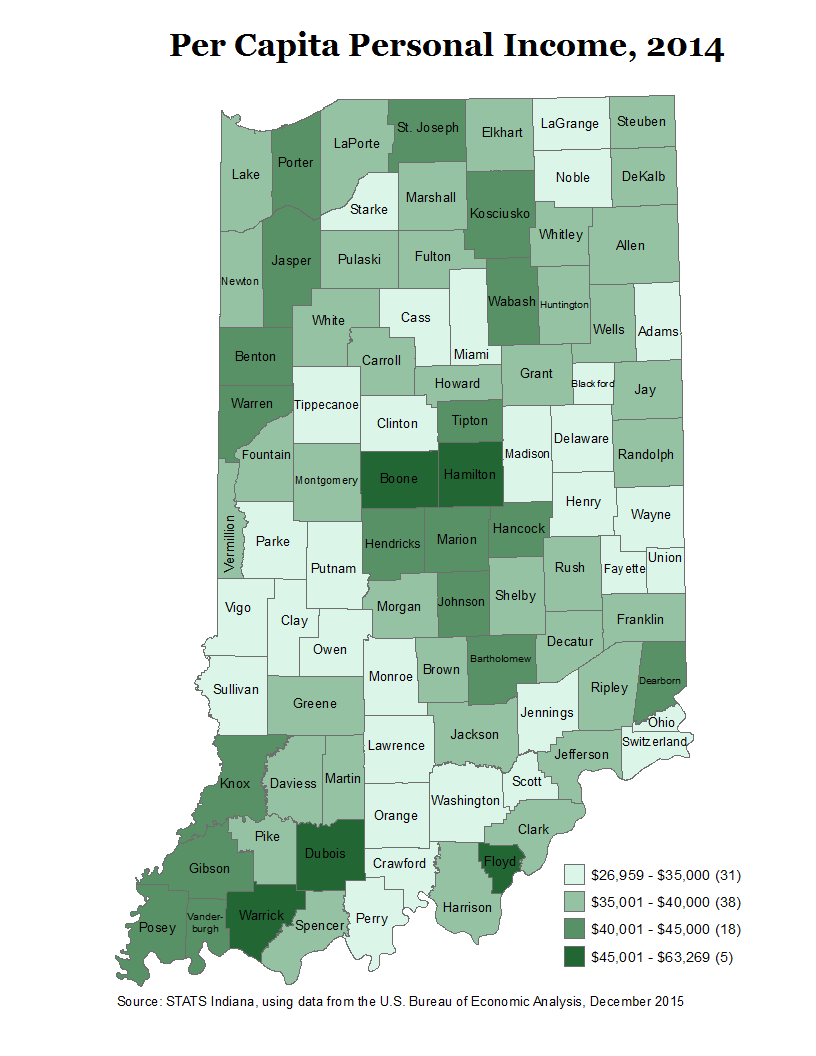
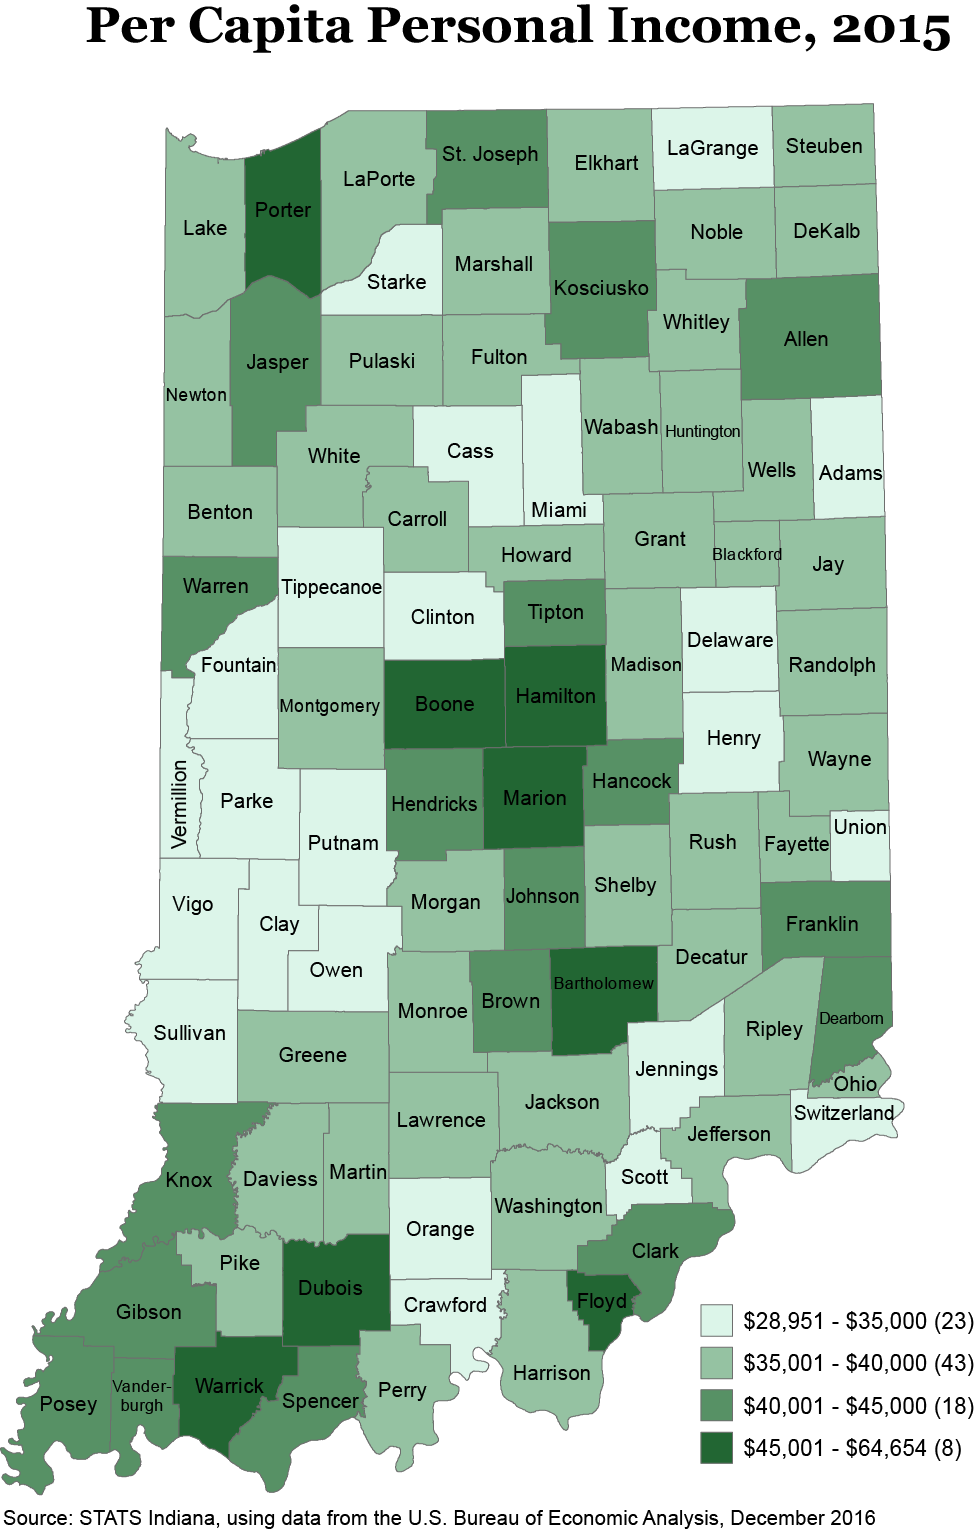
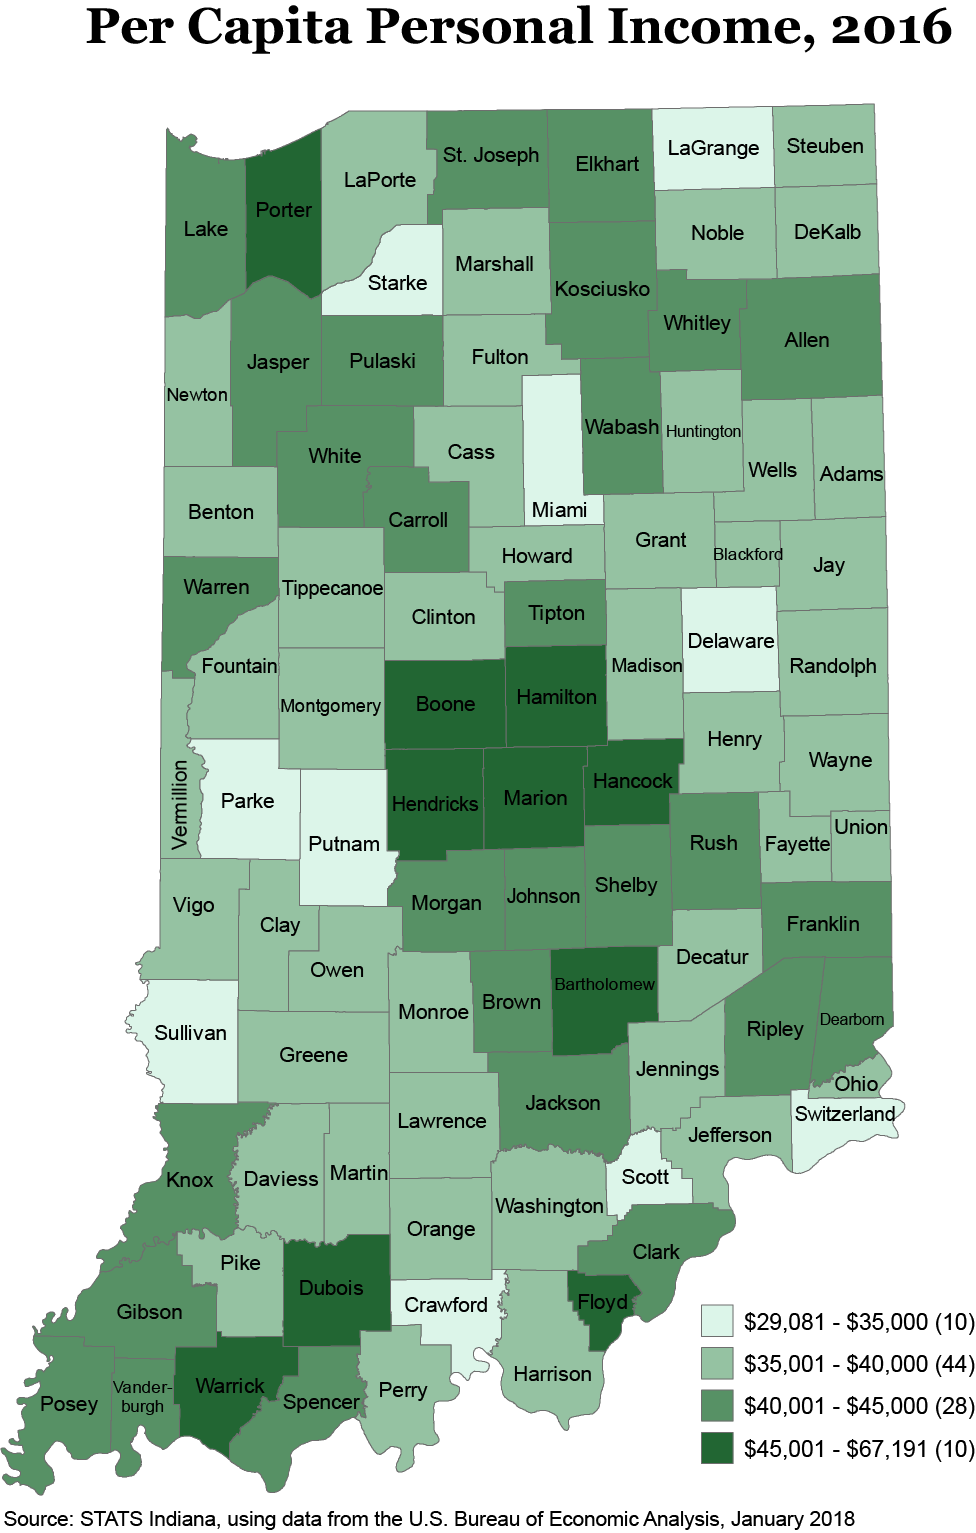
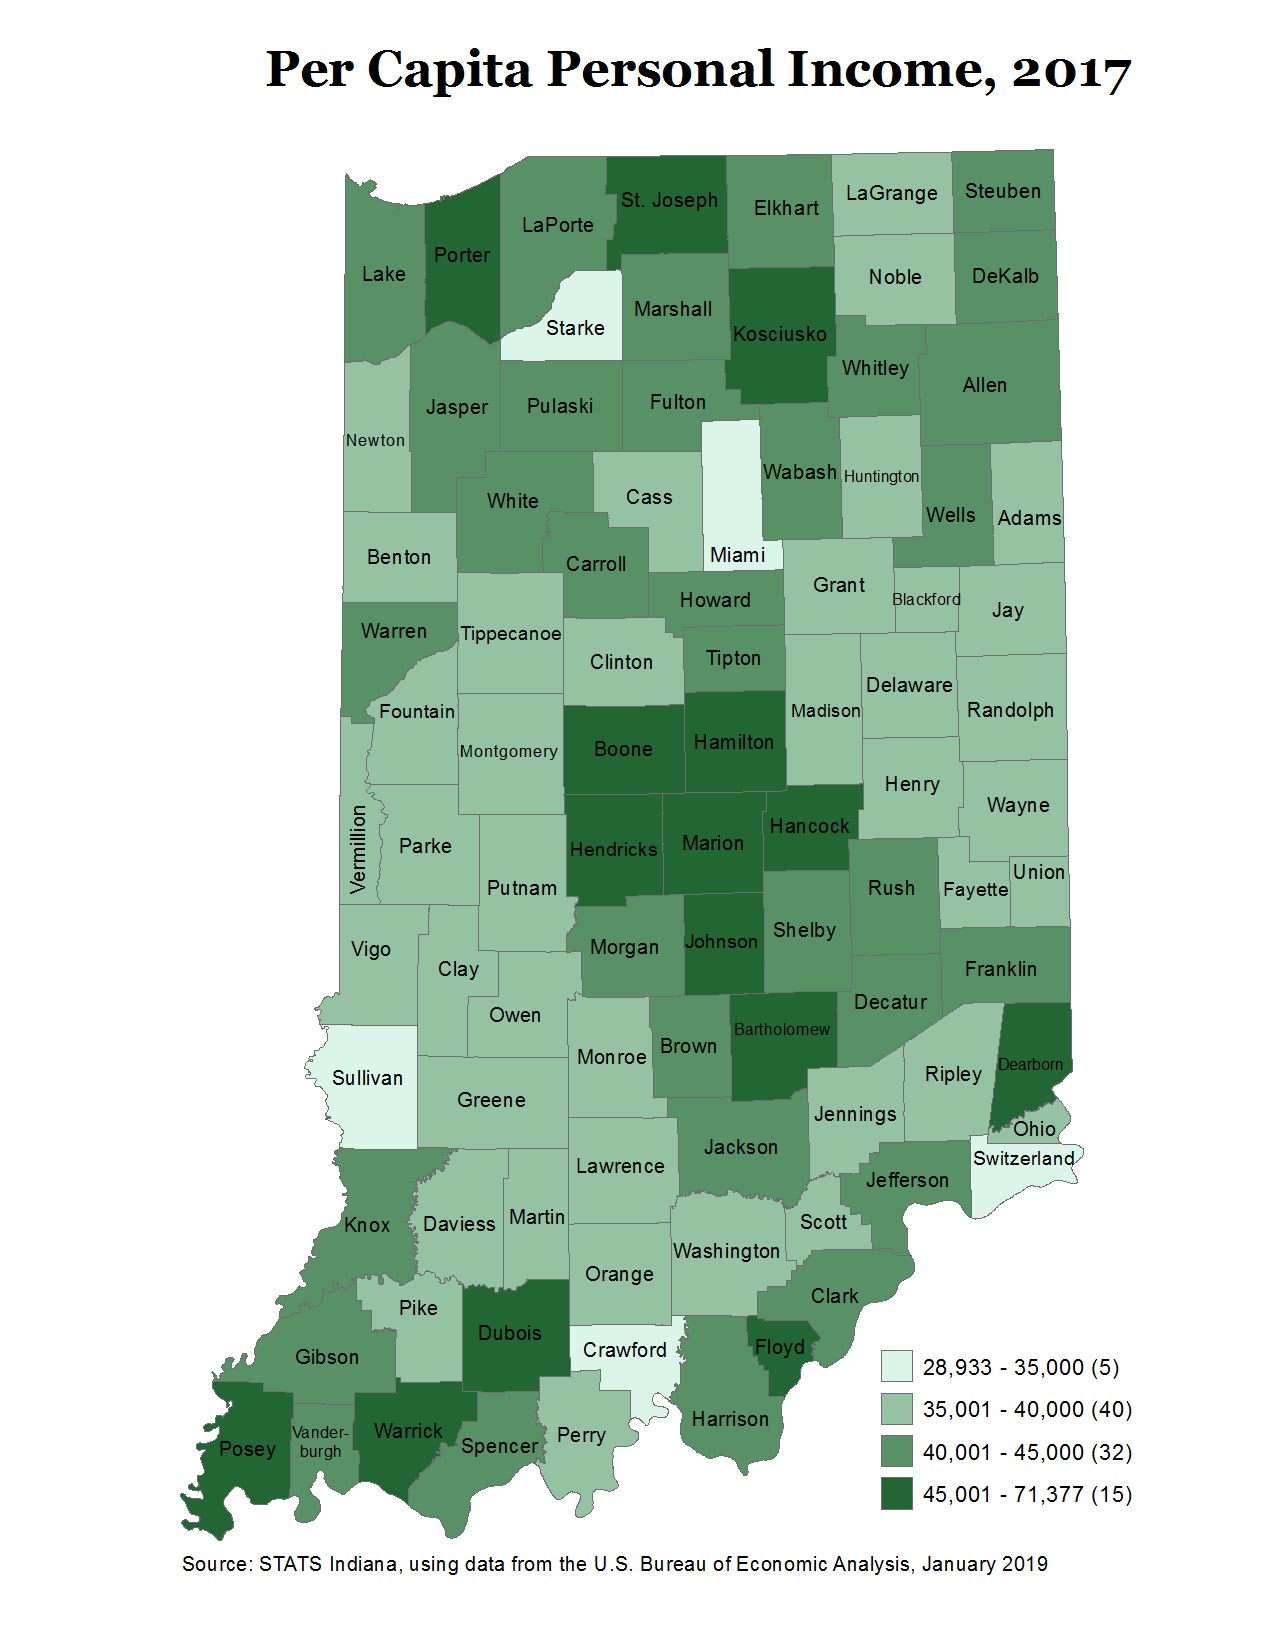
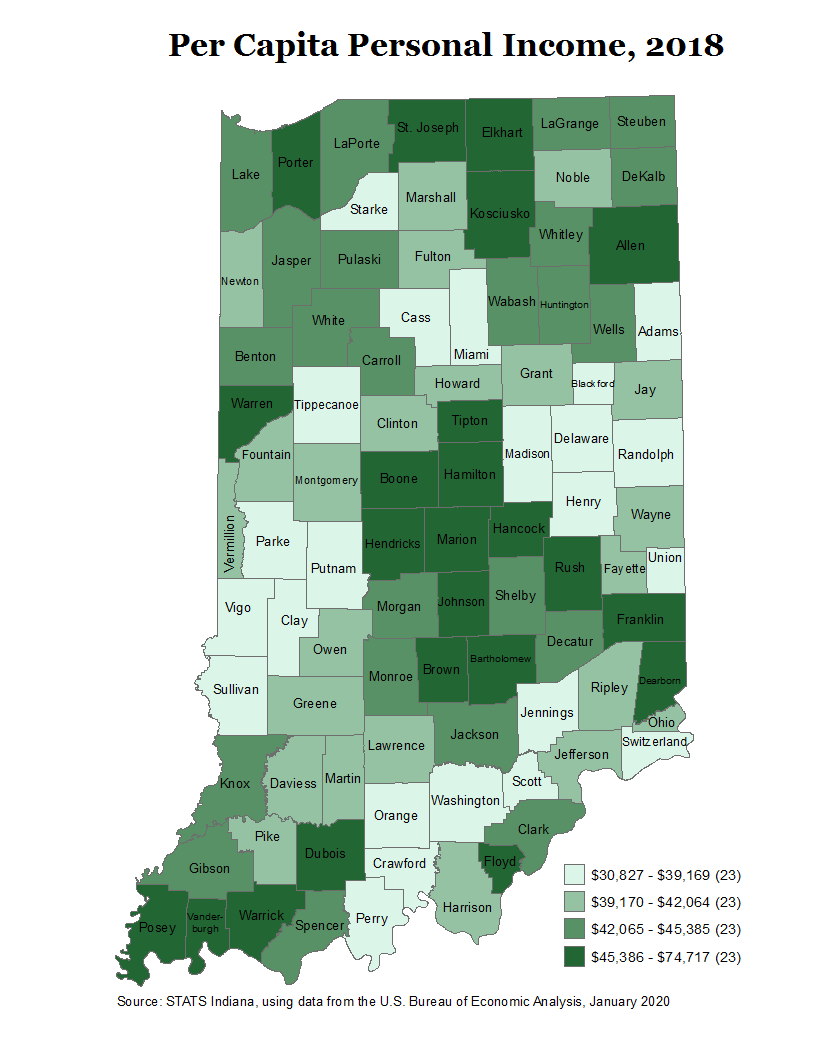
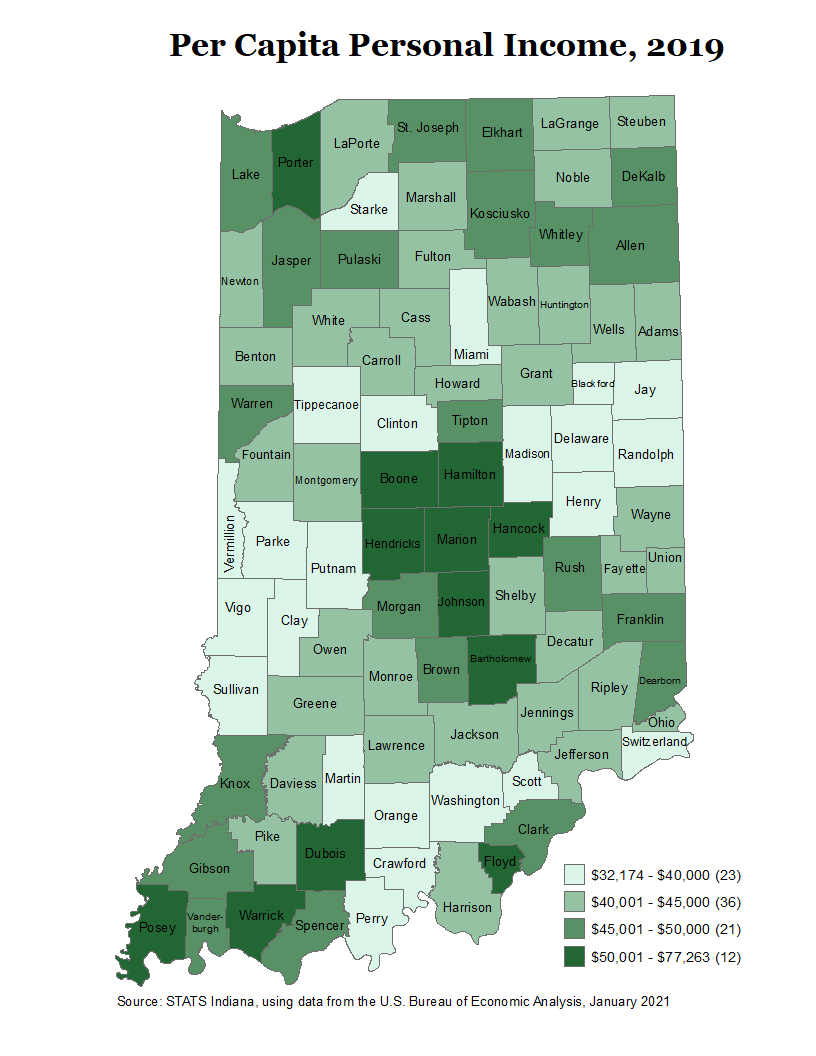
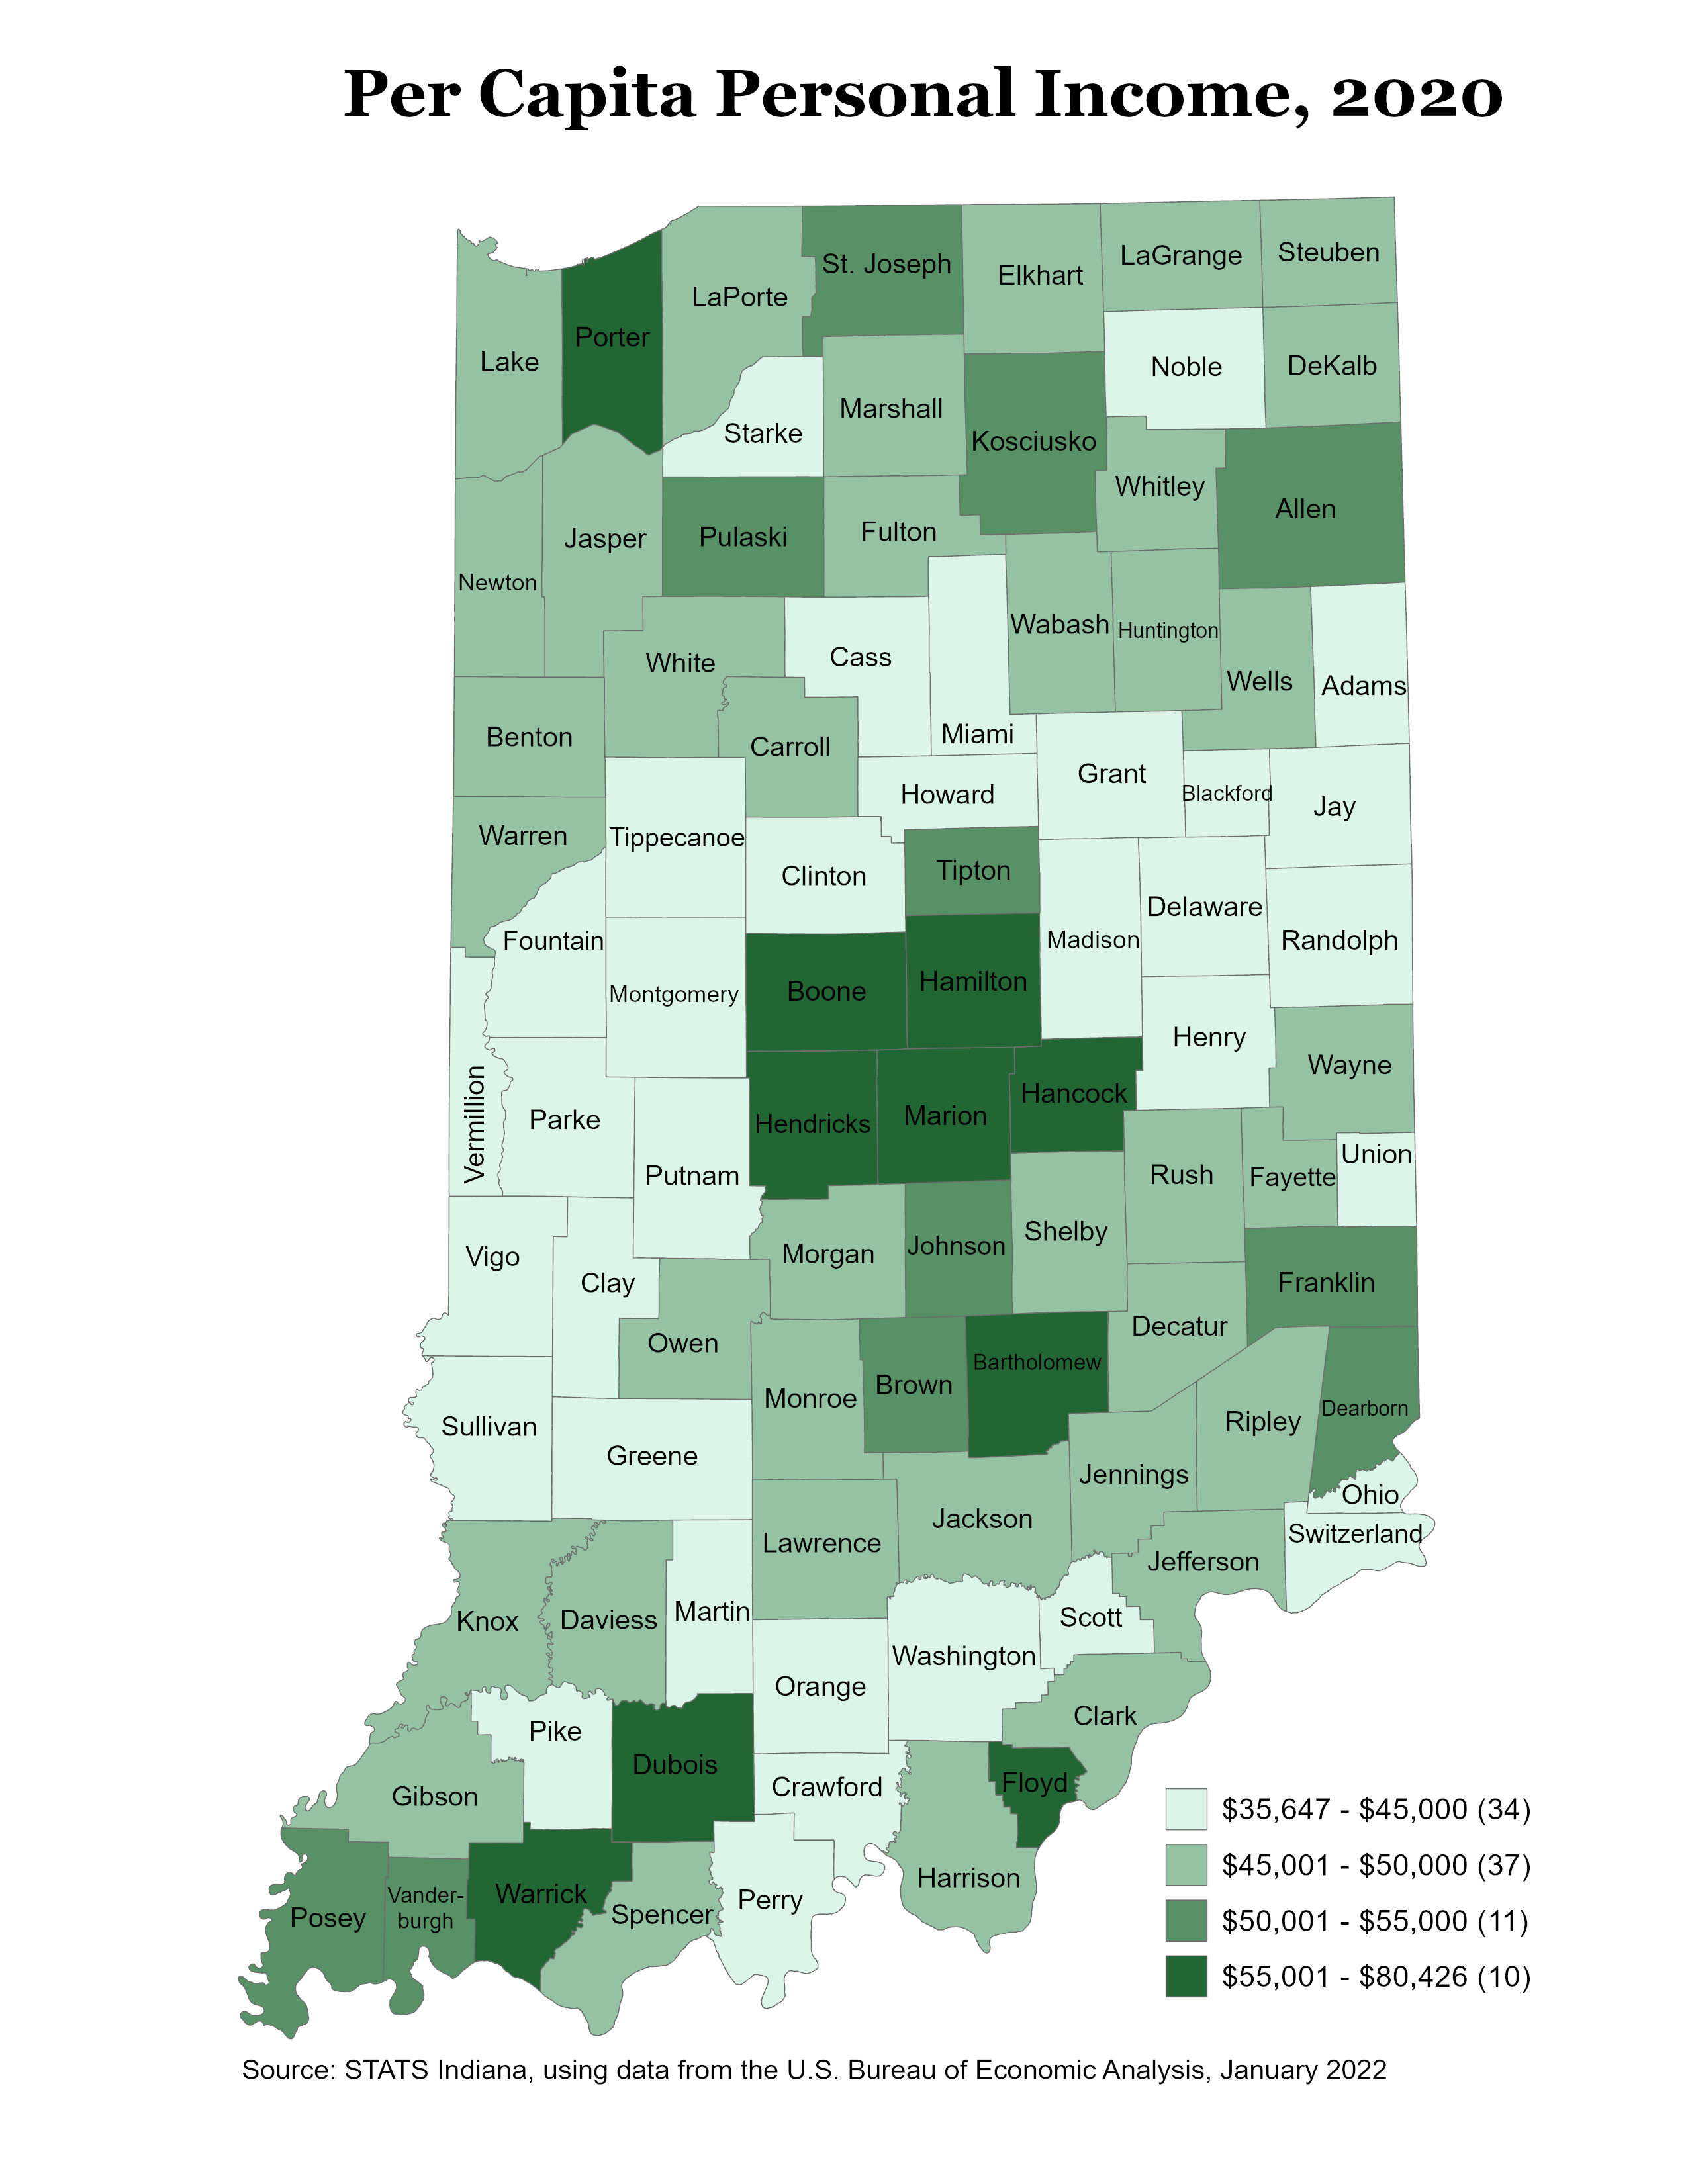
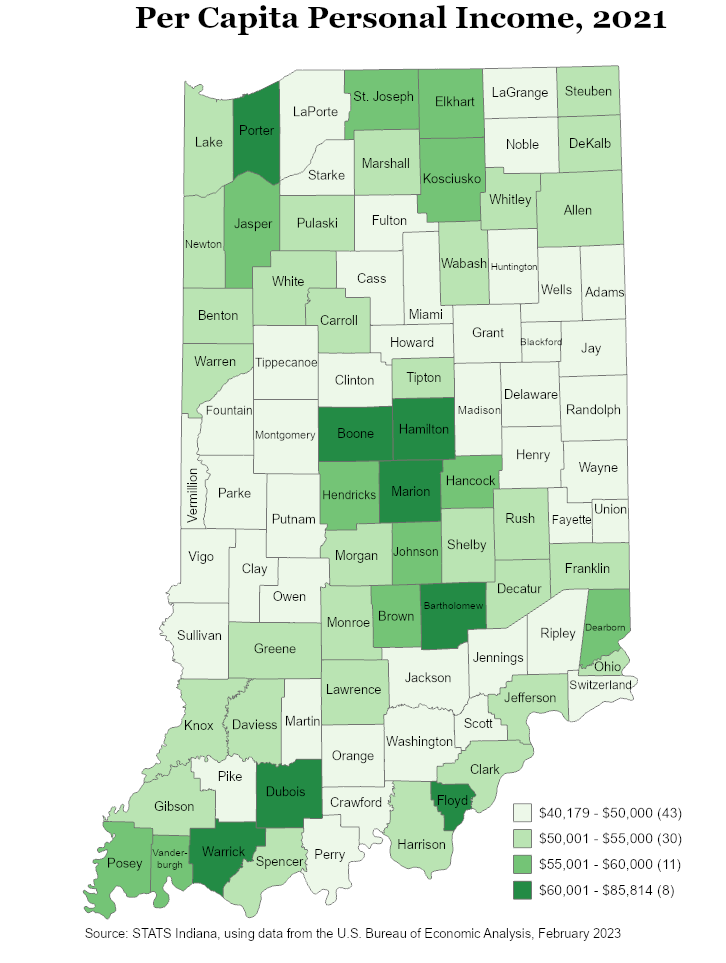
Per Capita Personal Income
- States
- Indiana Counties/Regions
- PCPI (2002) and Luxury Cars (2003): Counties
- PCPI Relative to Indiana: 2000: Regions
- PCPI Relative to U.S.: 2000: Regions
Change in Per Capita Personal Income
Per Capita Personal Income: Share of U.S.
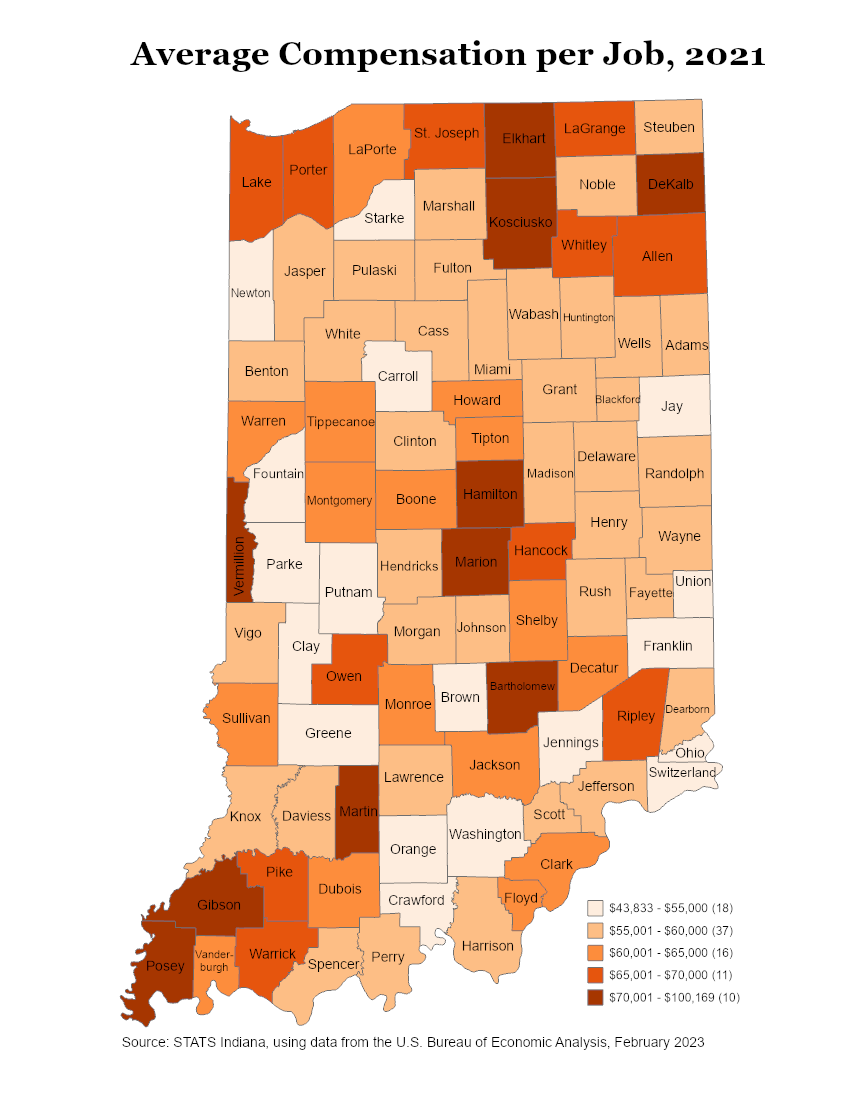
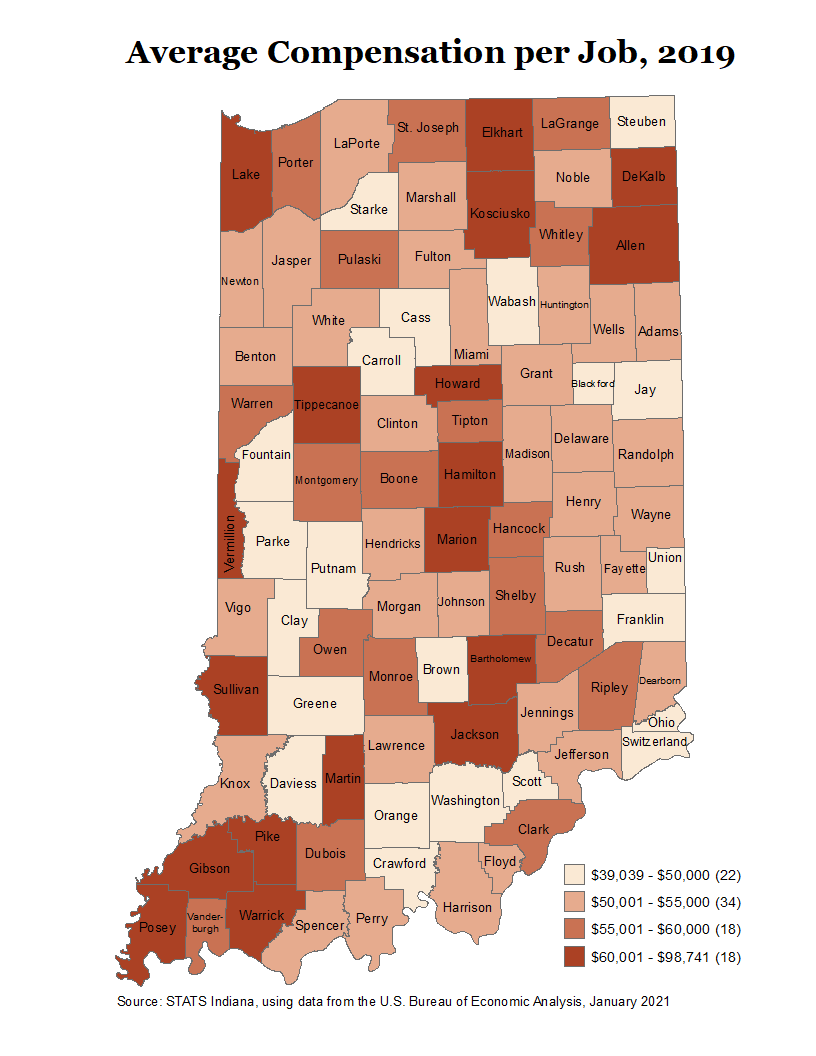
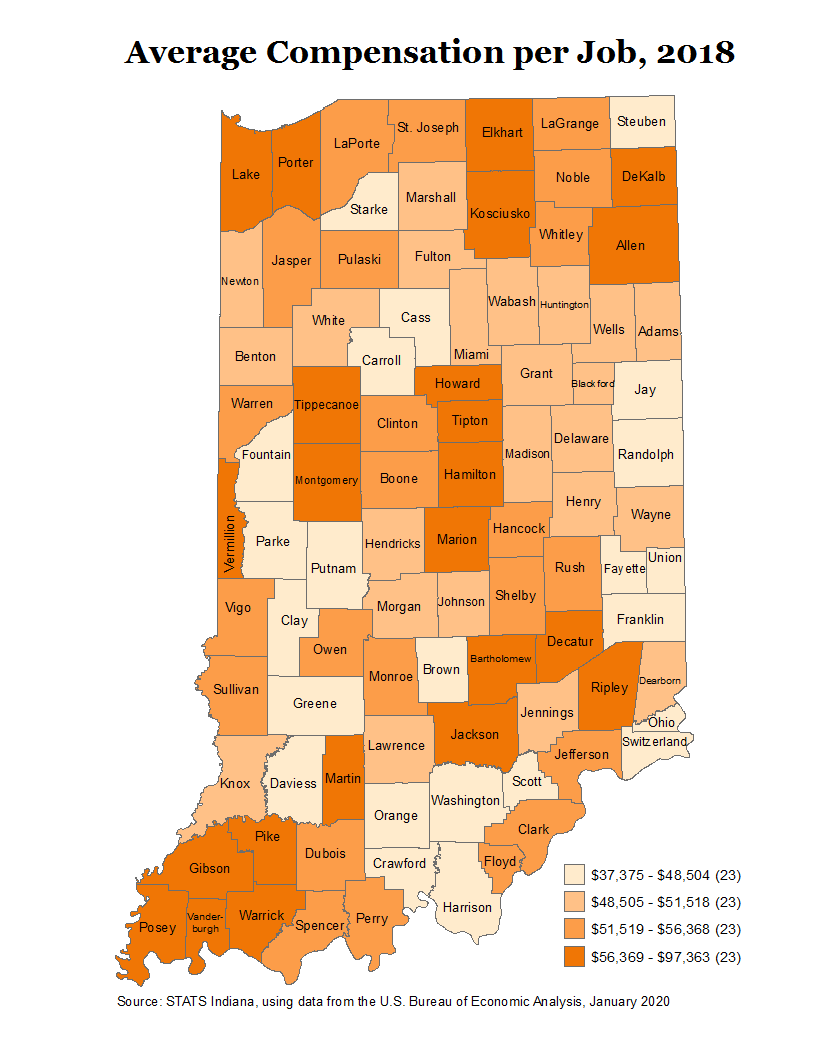
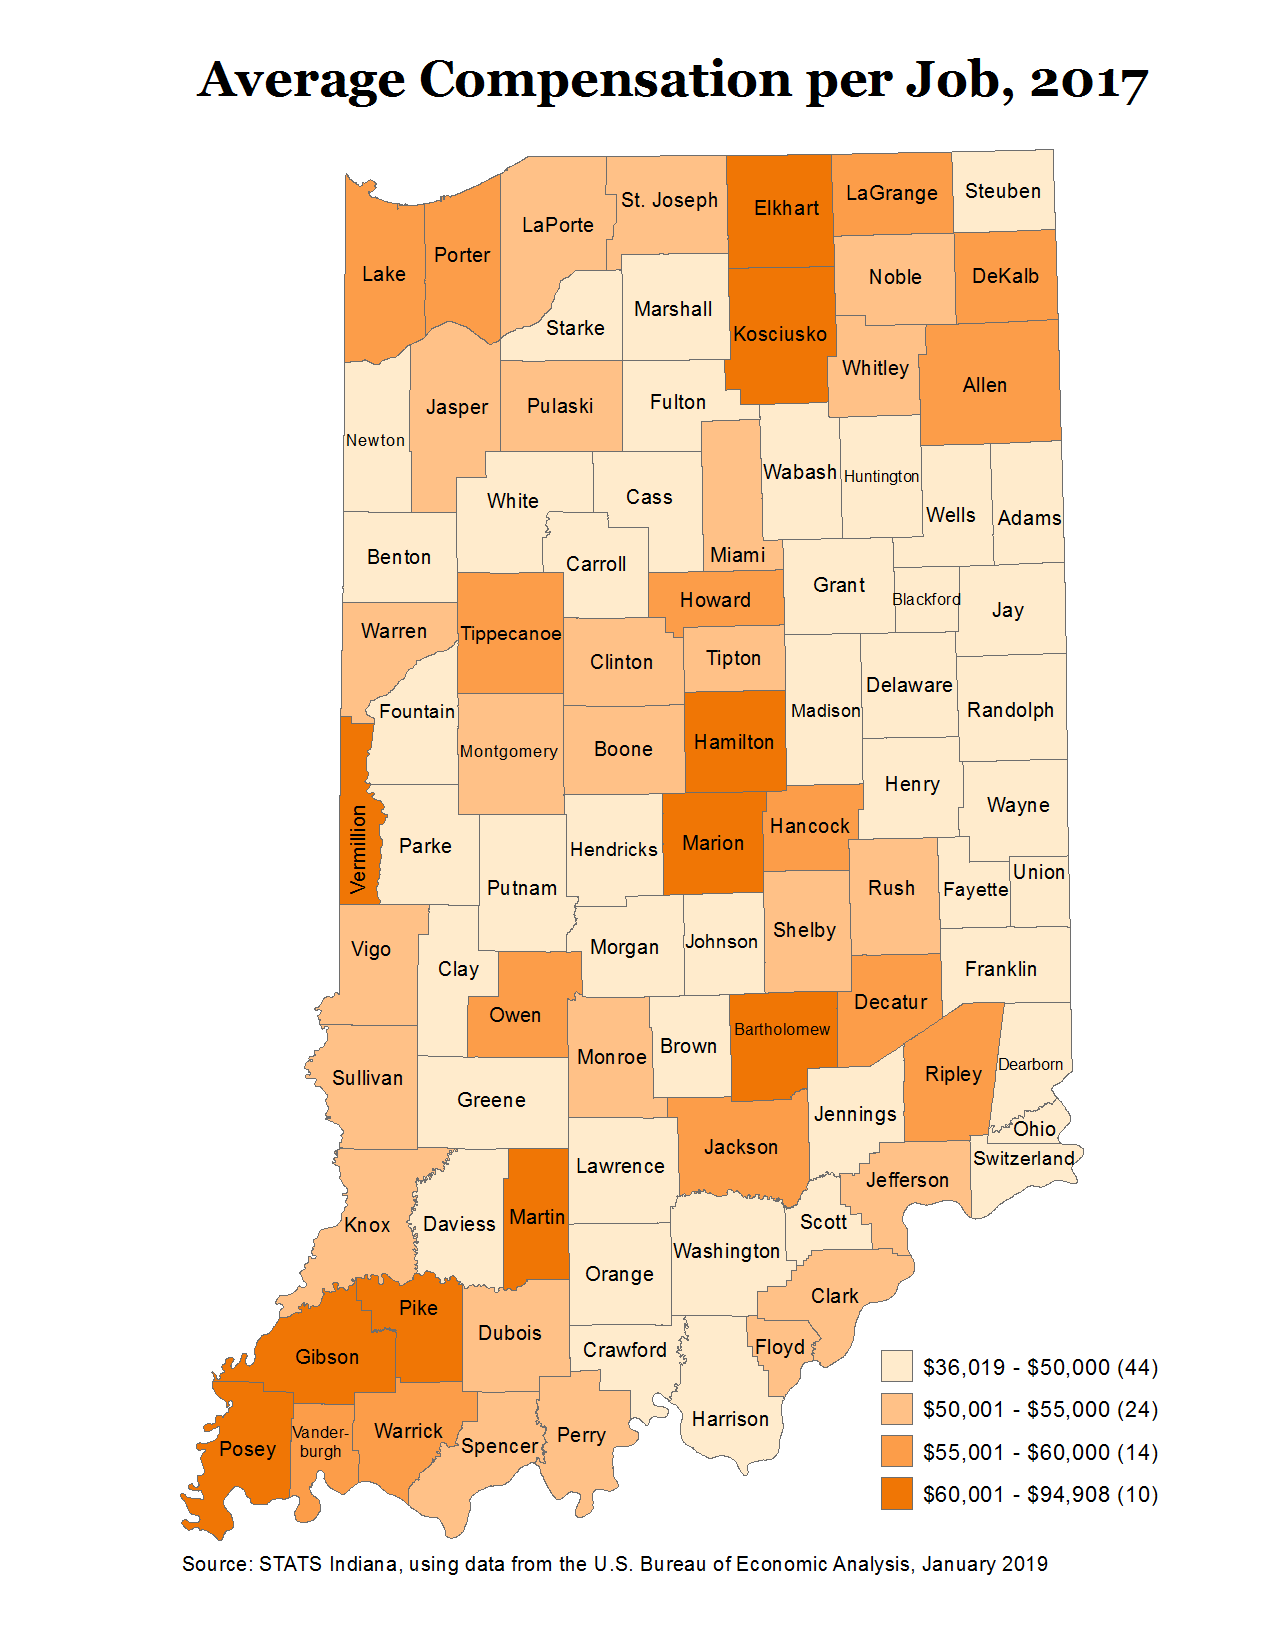
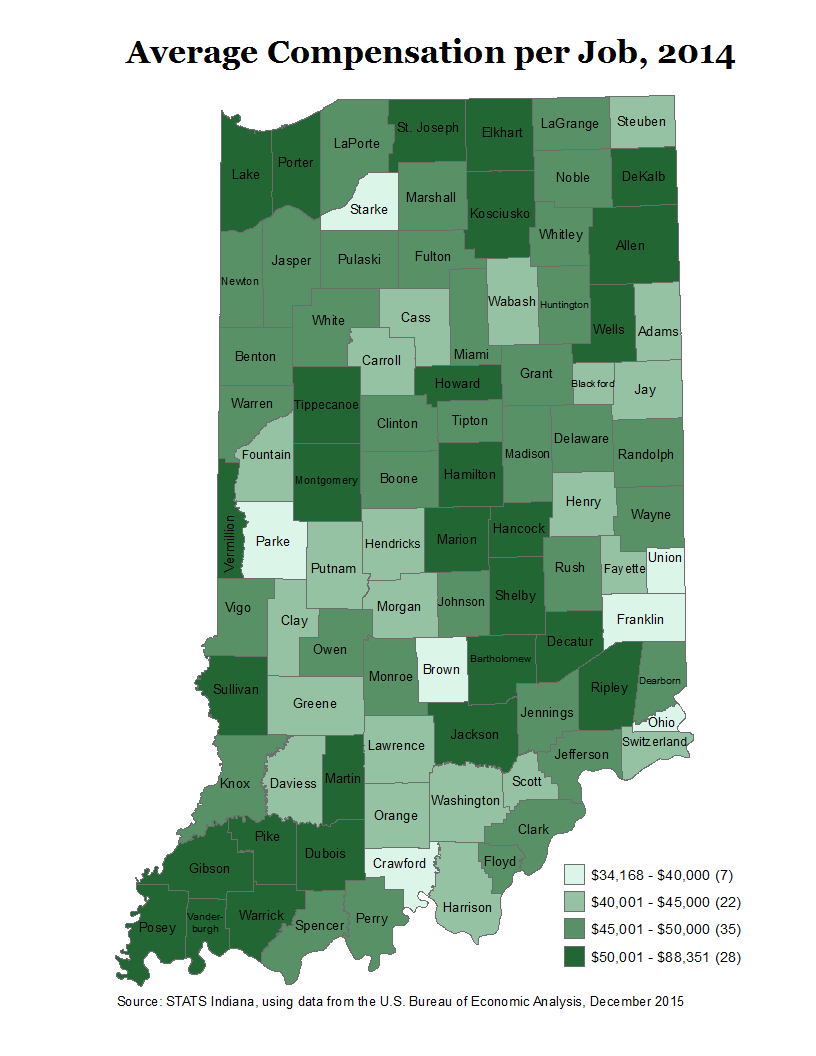
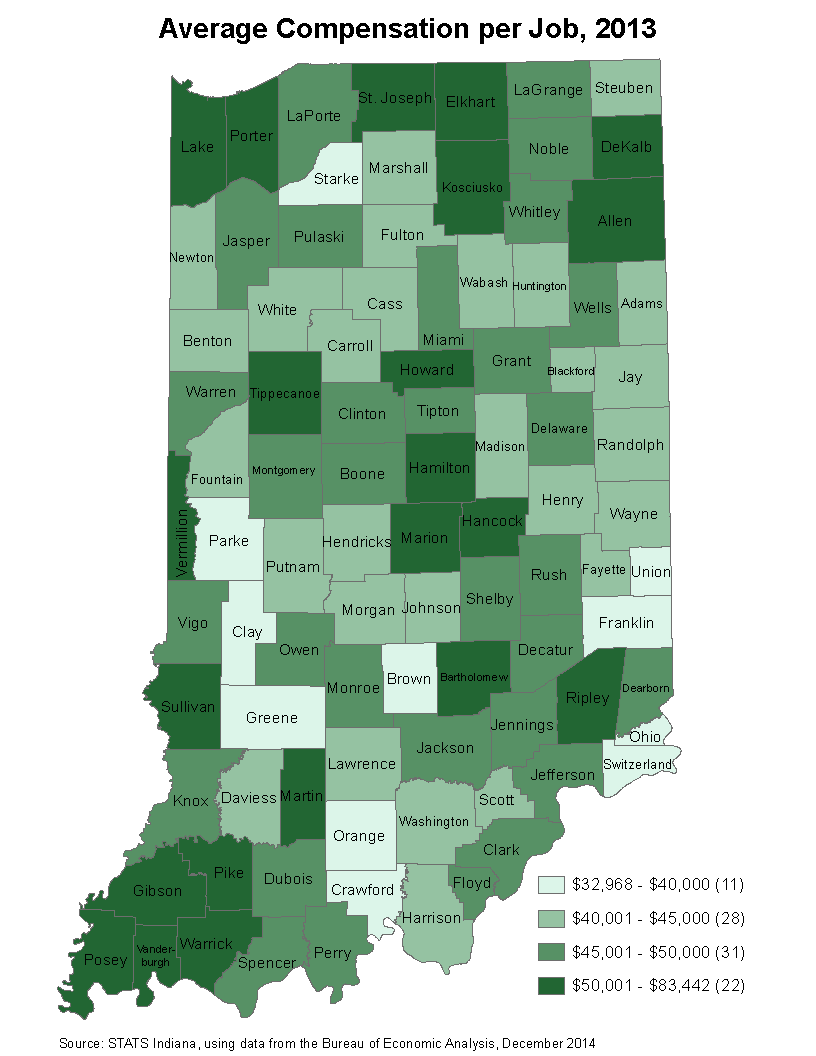
Average Compensation per Job: Counties
- Prisons in Indiana: 2011
- Selected Indiana Health Facilities by Fund: June 2011
- Most Popular Vehicle Make by County: 2004
- Wage Base for Unemployment Insurance Tax: 2004: States
- Hospitals in Indiana: 2000 -- By Type or By Ownership
- Nursing Homes in Indiana: 2000 -- GIF or PDF
Annual Estimates
- Fastest-growing cities and towns, 2018-2019
- Fastest-growing cities and towns, 2017-2018
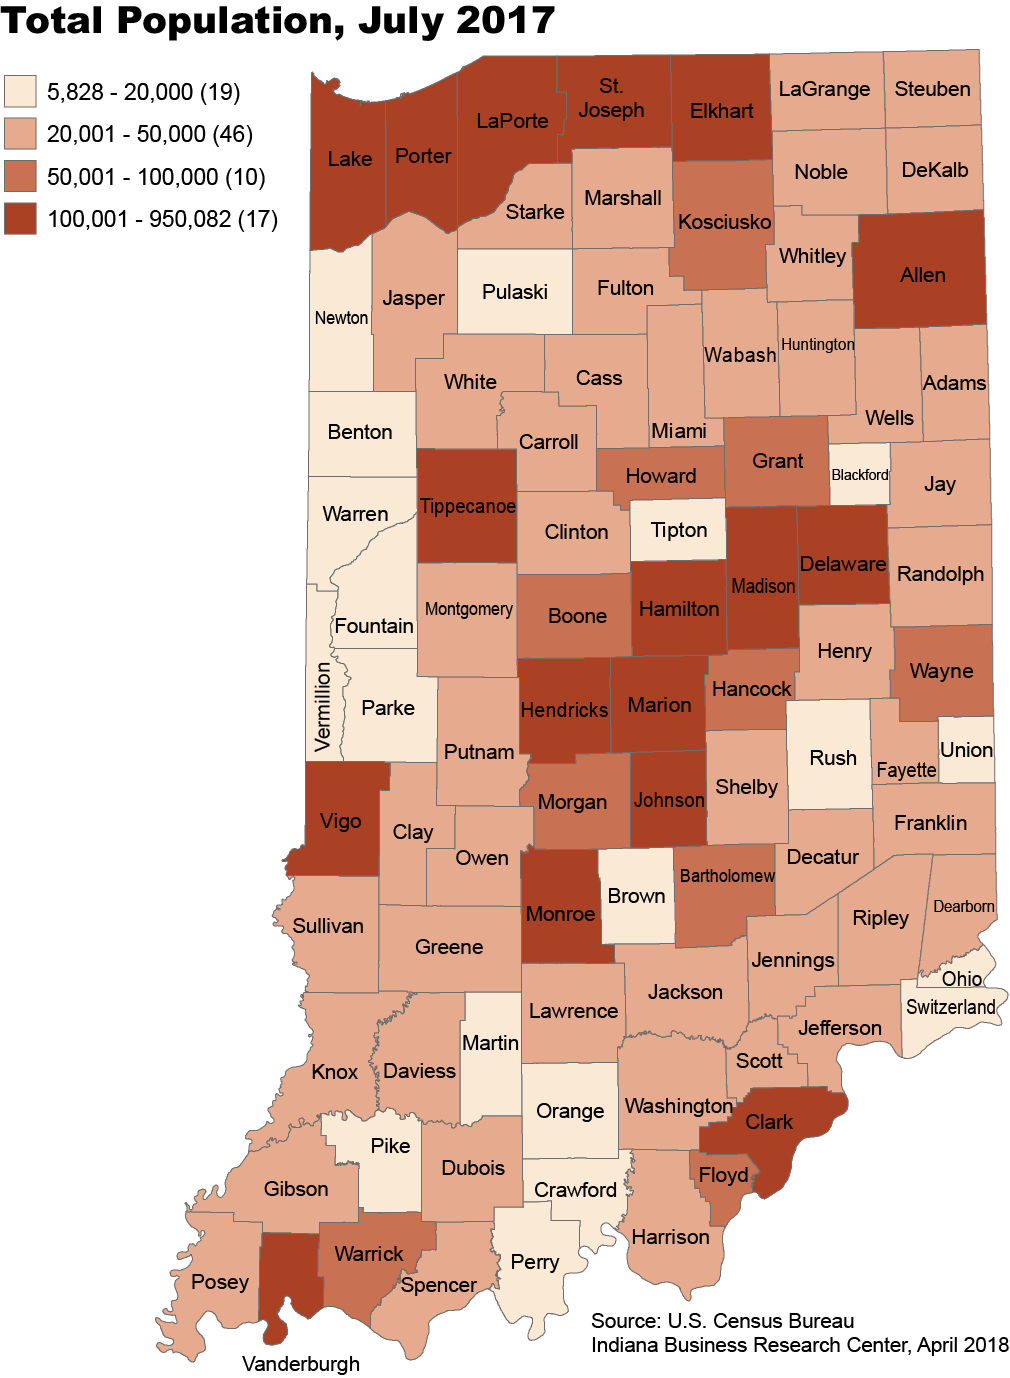
- Total Population: 2017
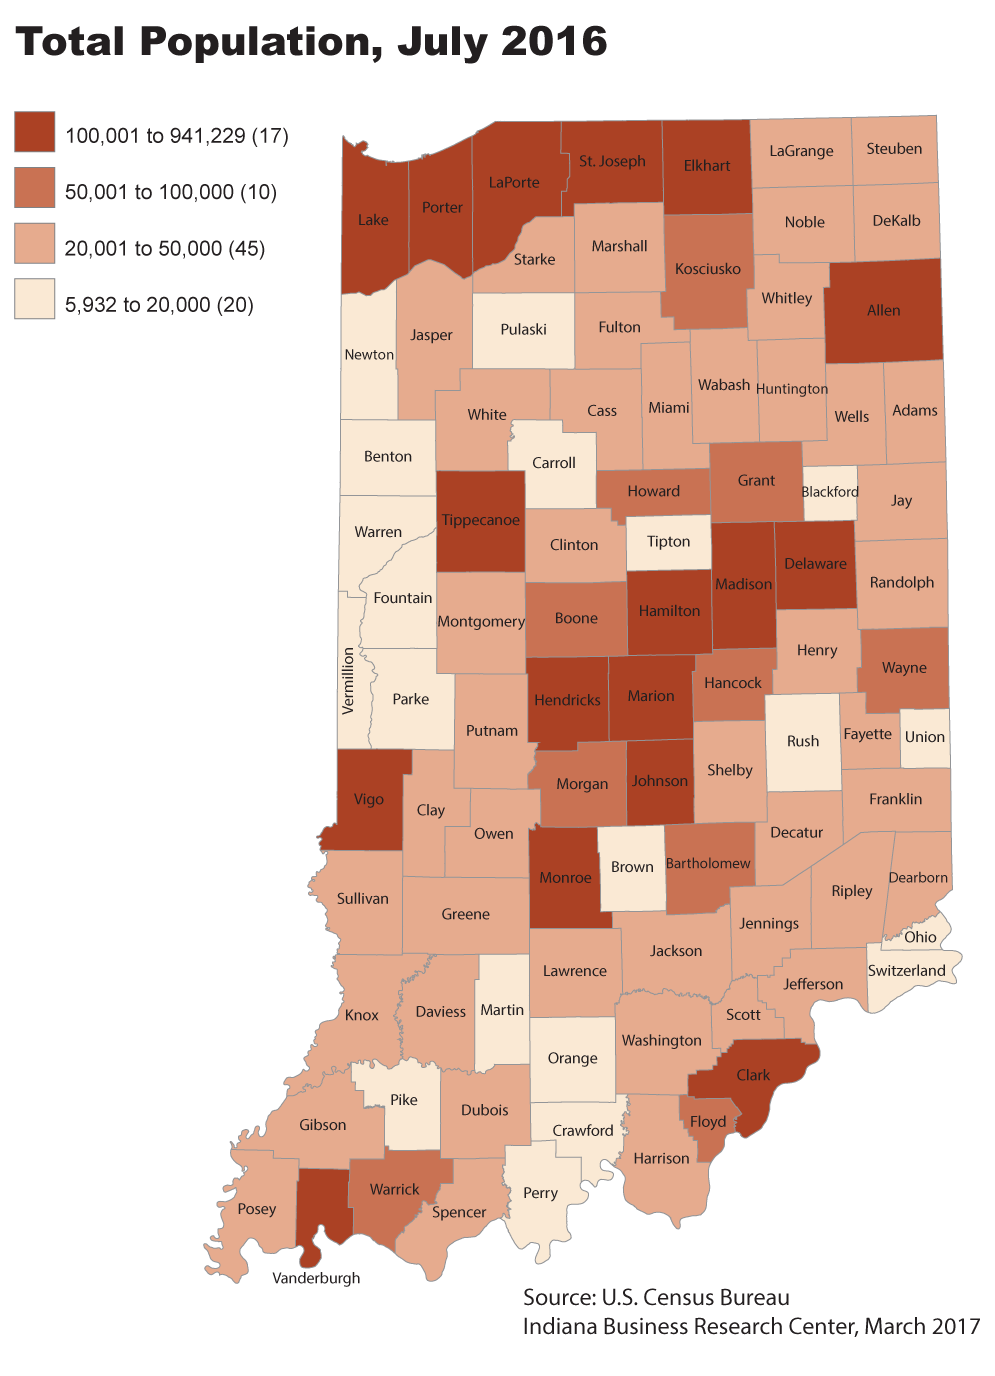
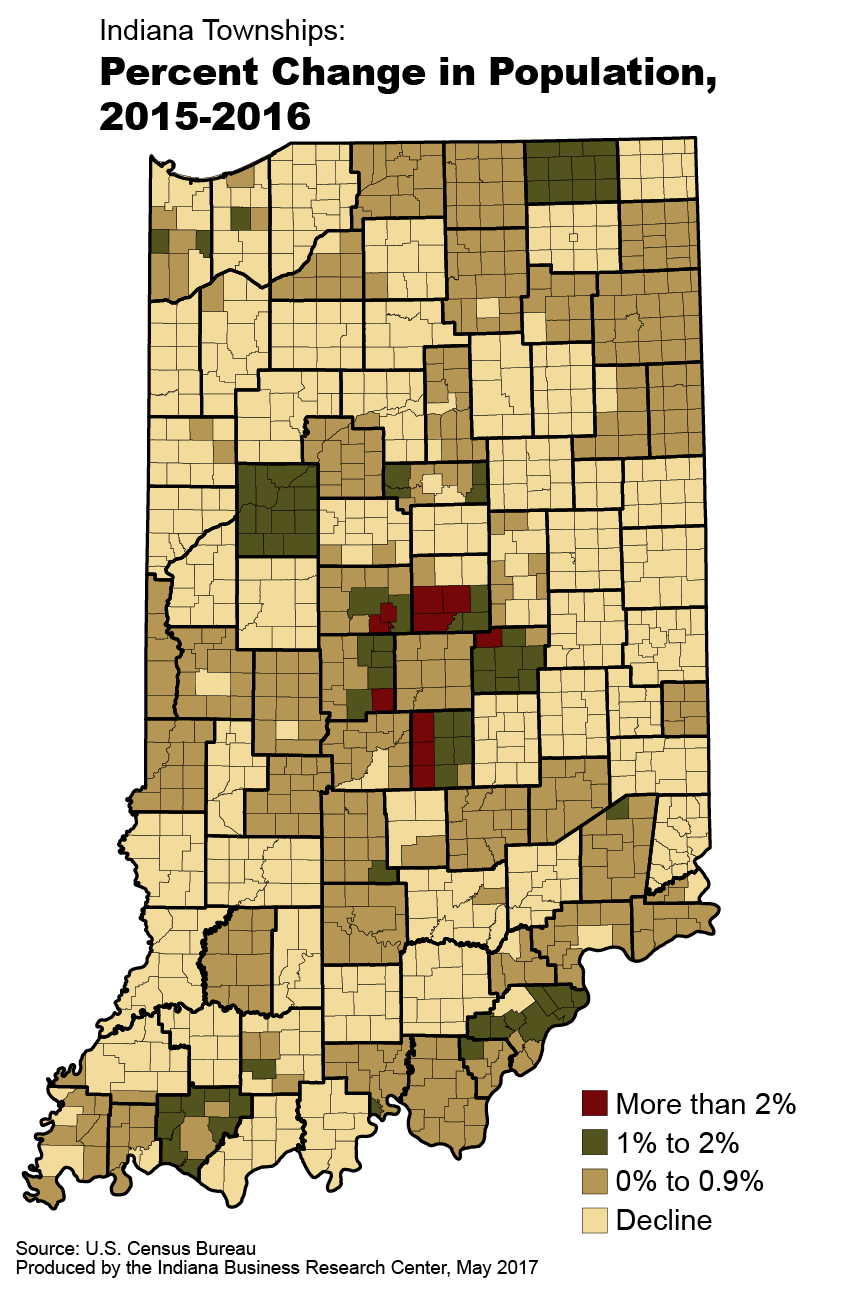
- 2016 Total Population
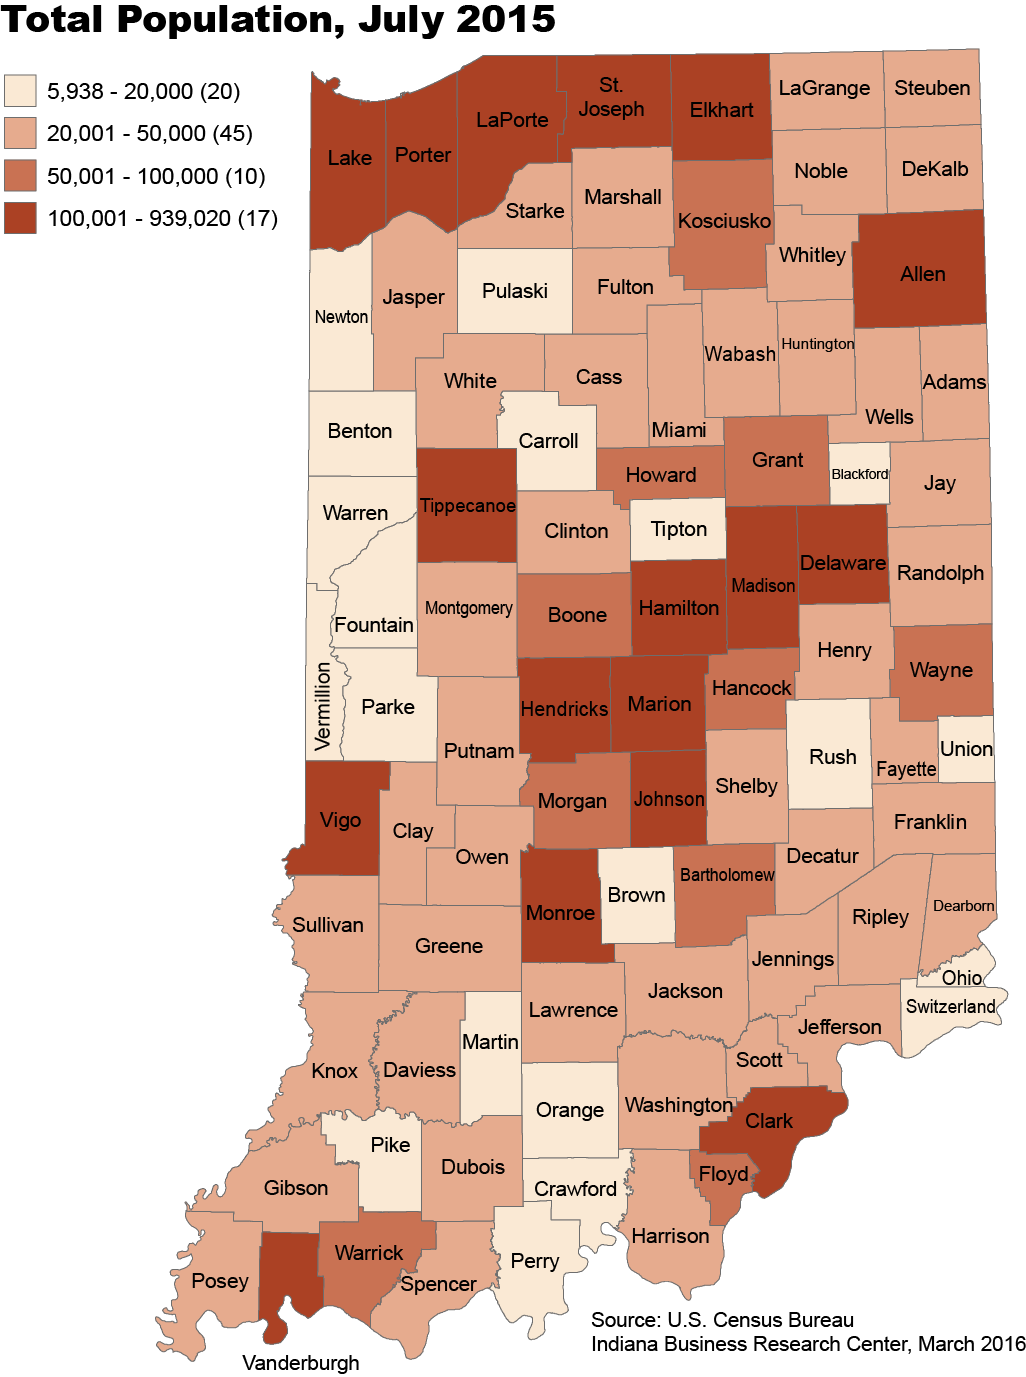
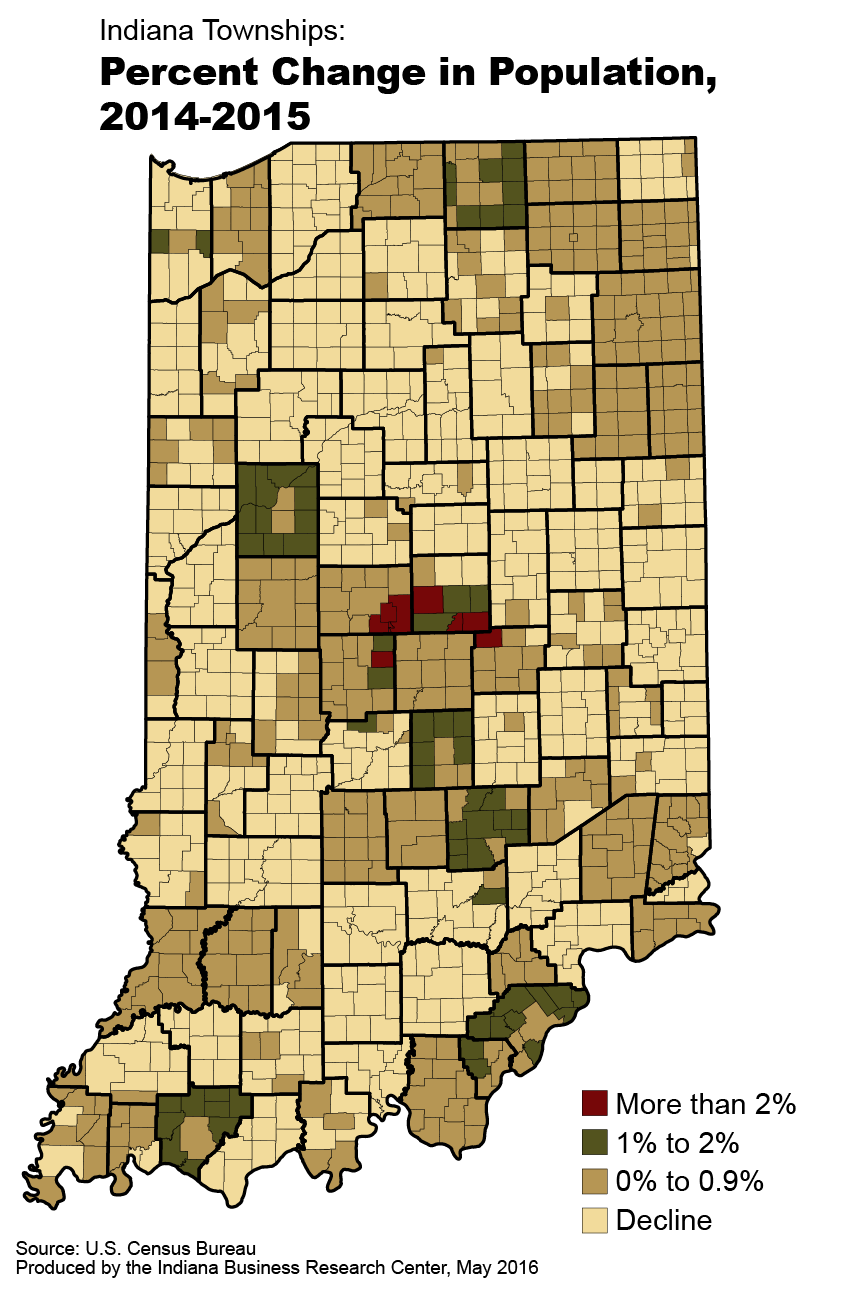
- 2015 Total Population
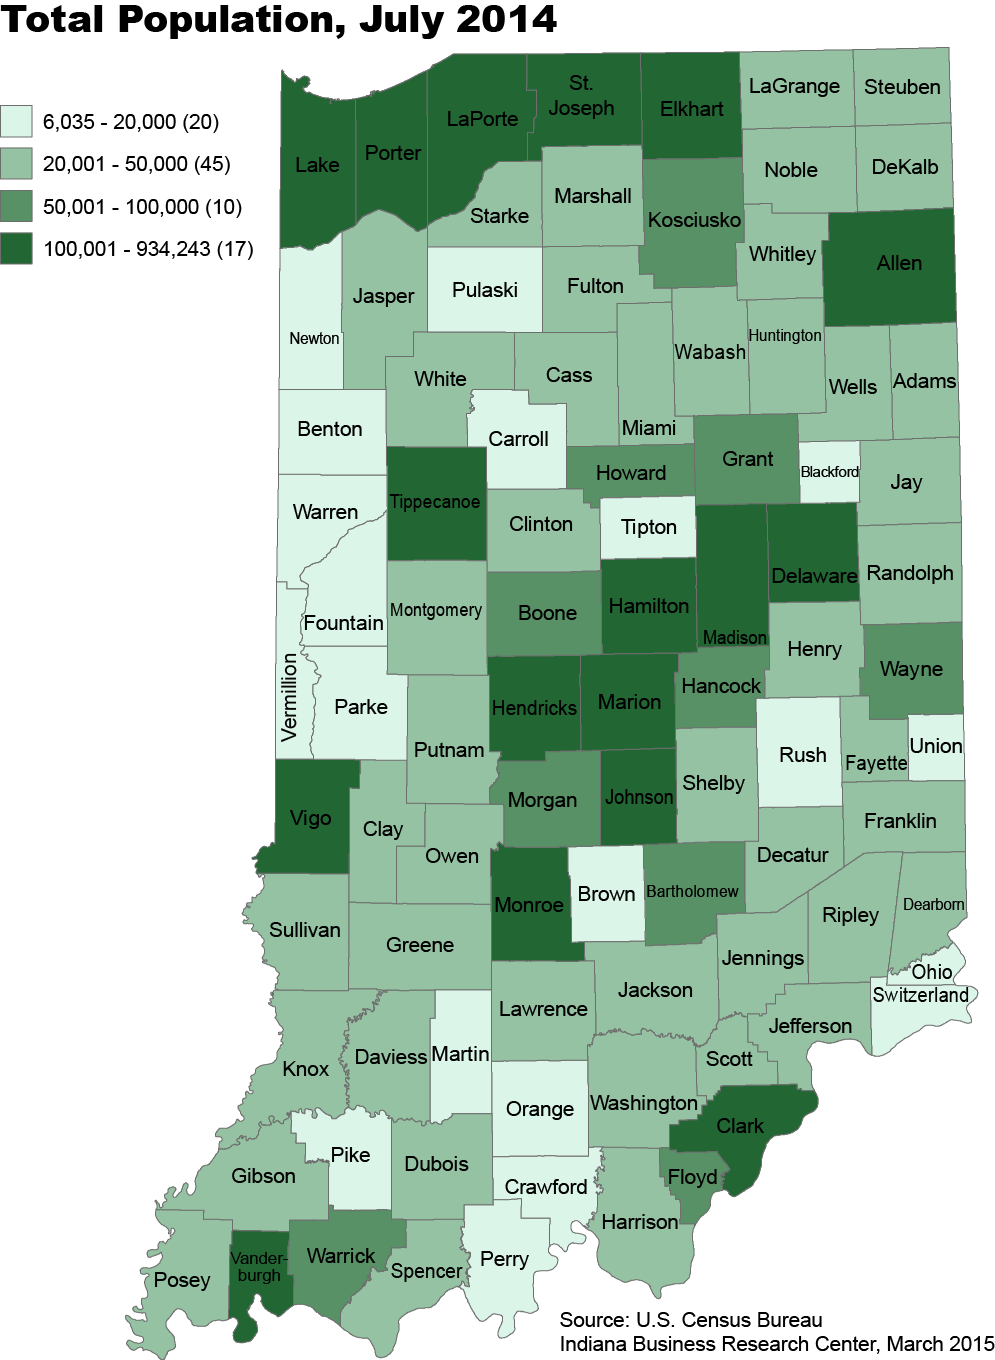
- 2014 Total Population
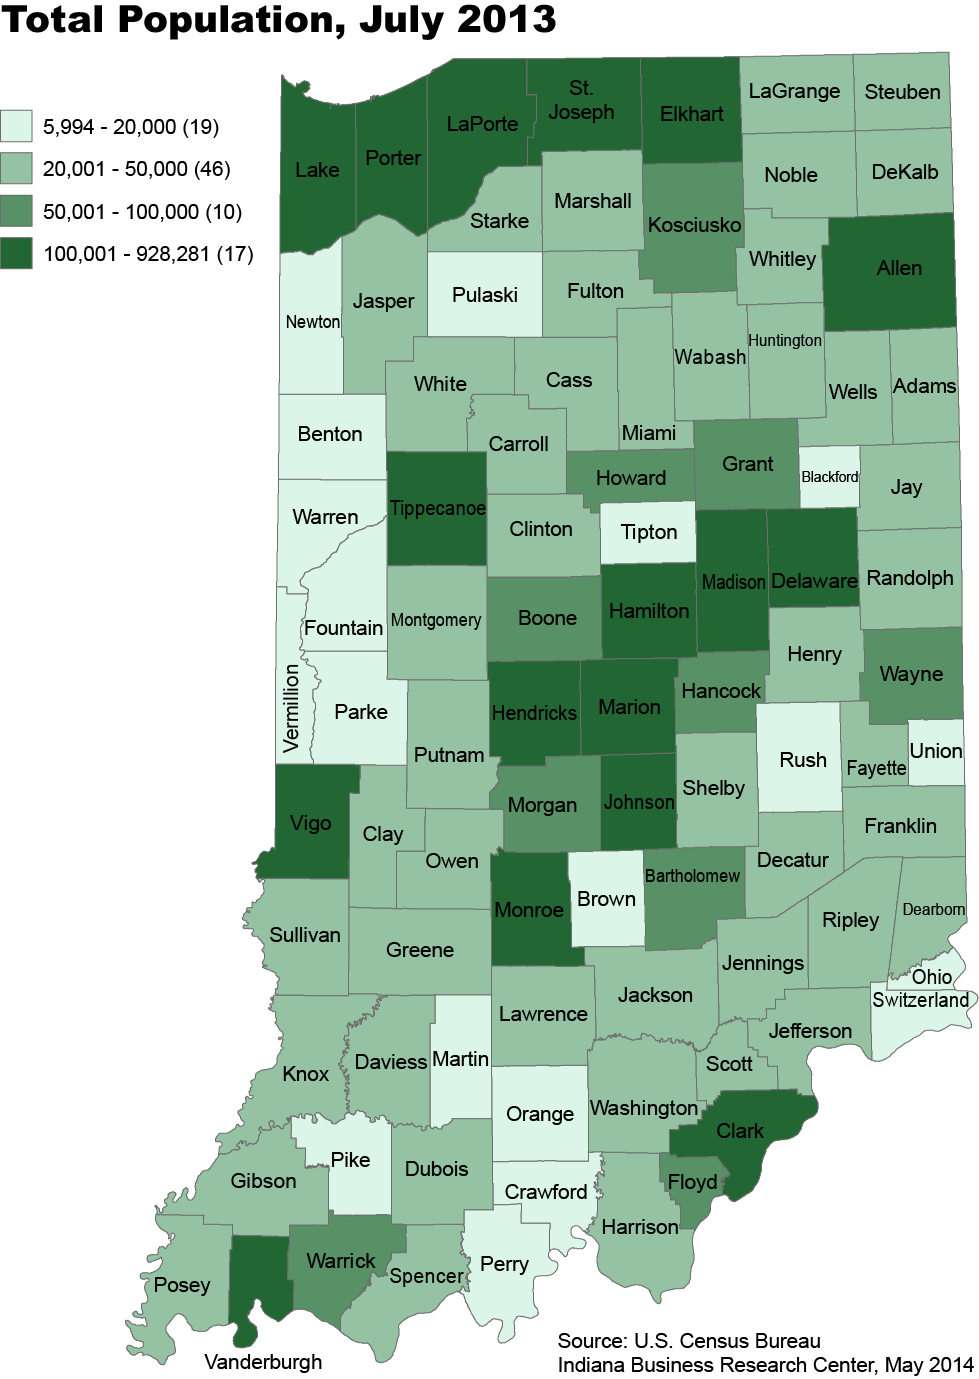
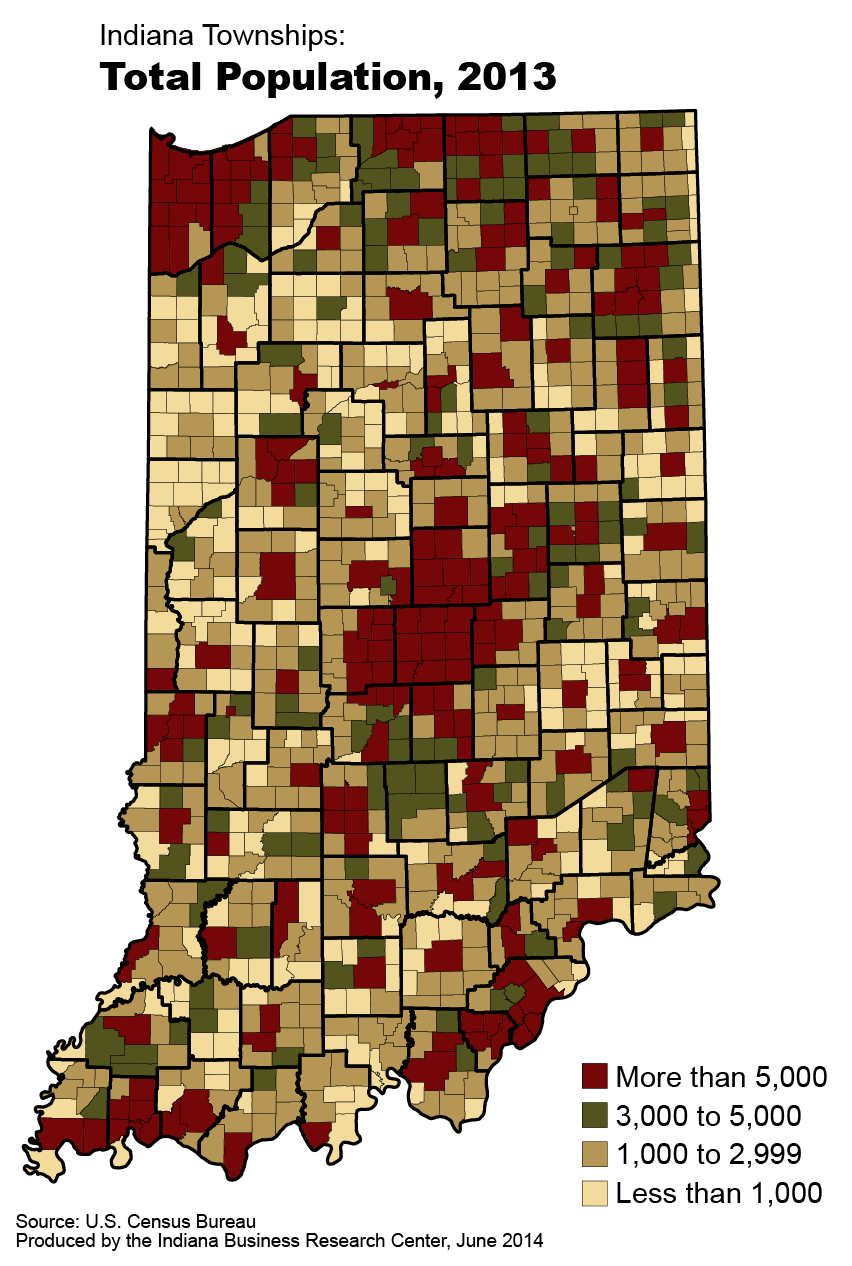
- 2013 Total Population
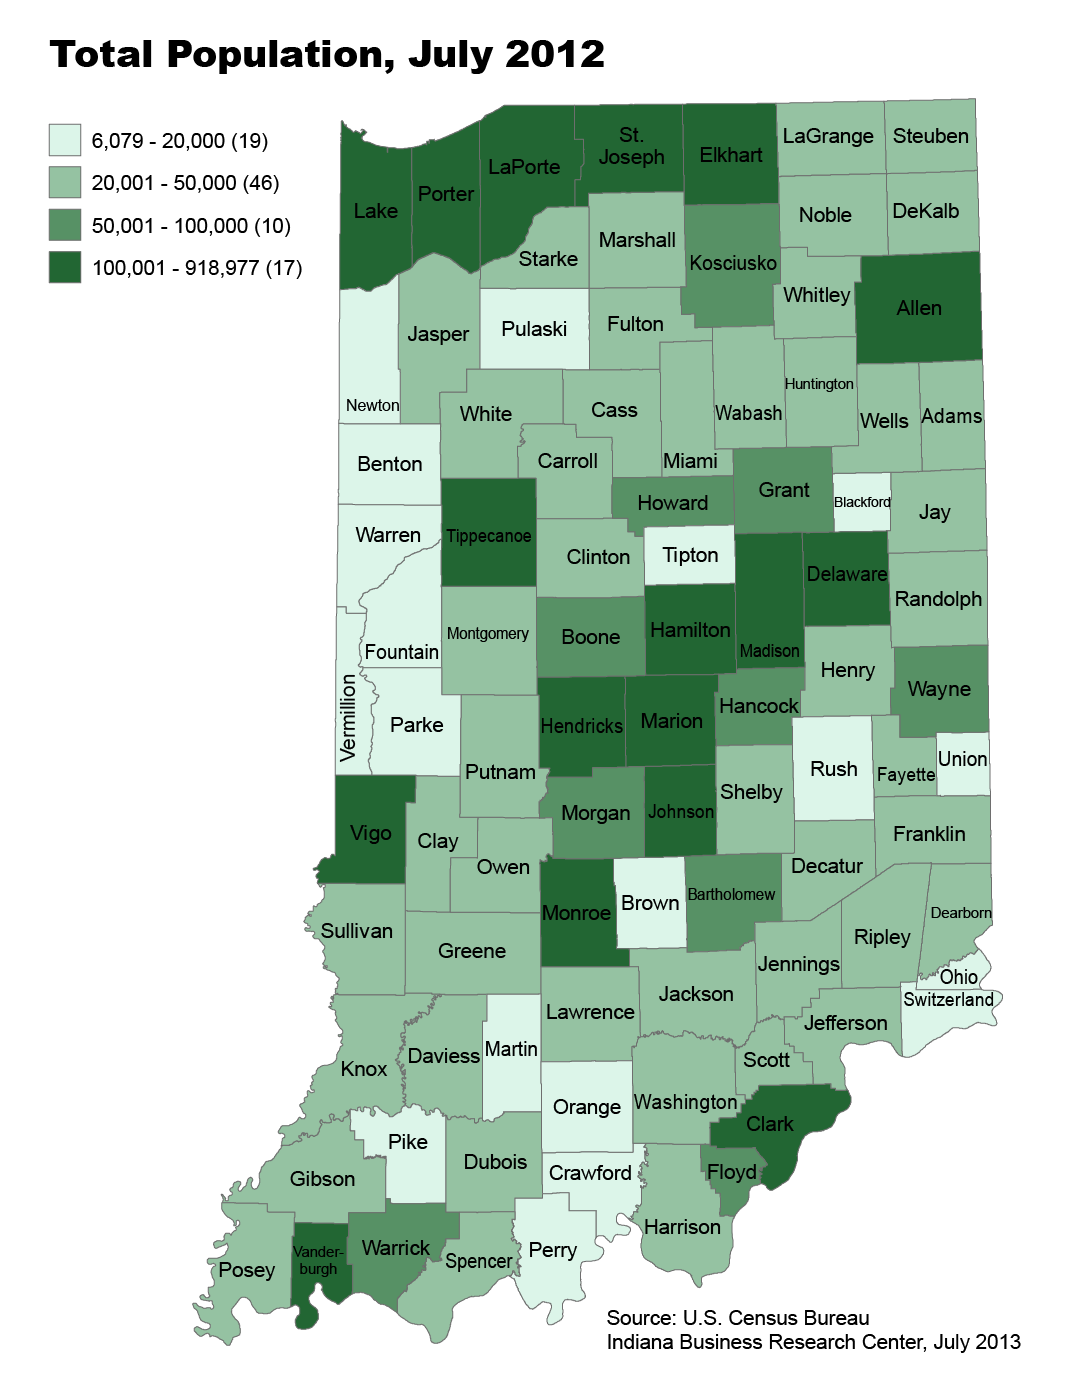
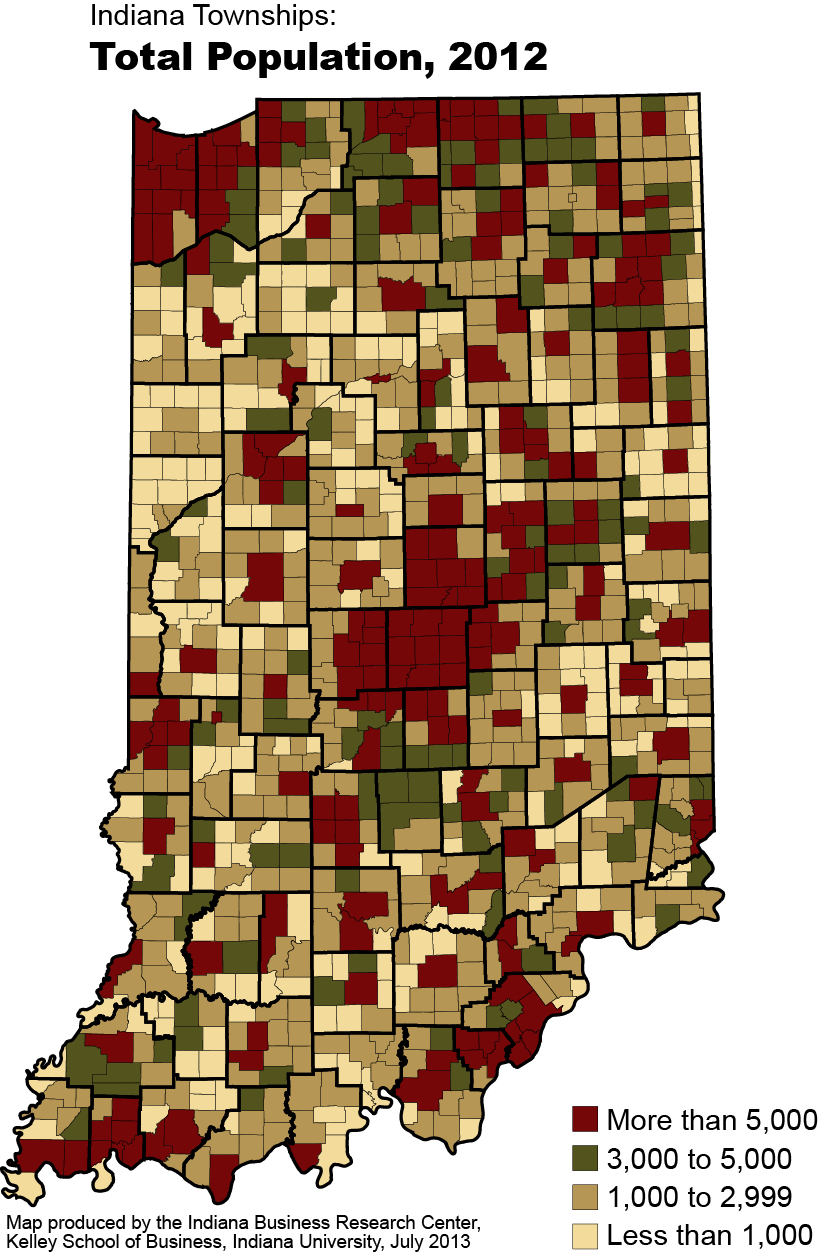
- 2012 Total Population
- 2010 Total Population
- 2009 Total Population
- 2008 Total Population
- 2007 Total Population
- 2006 Total Population
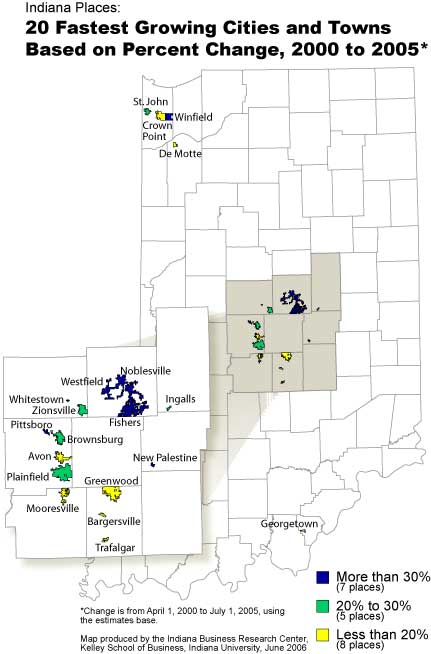
- 2005 Total Population
- 2004 Total Population
- 2003 Total Population
- Counties
- U.S. Counties
- Townships
- Regions
- Metros
- Cities and Towns
- Population Change
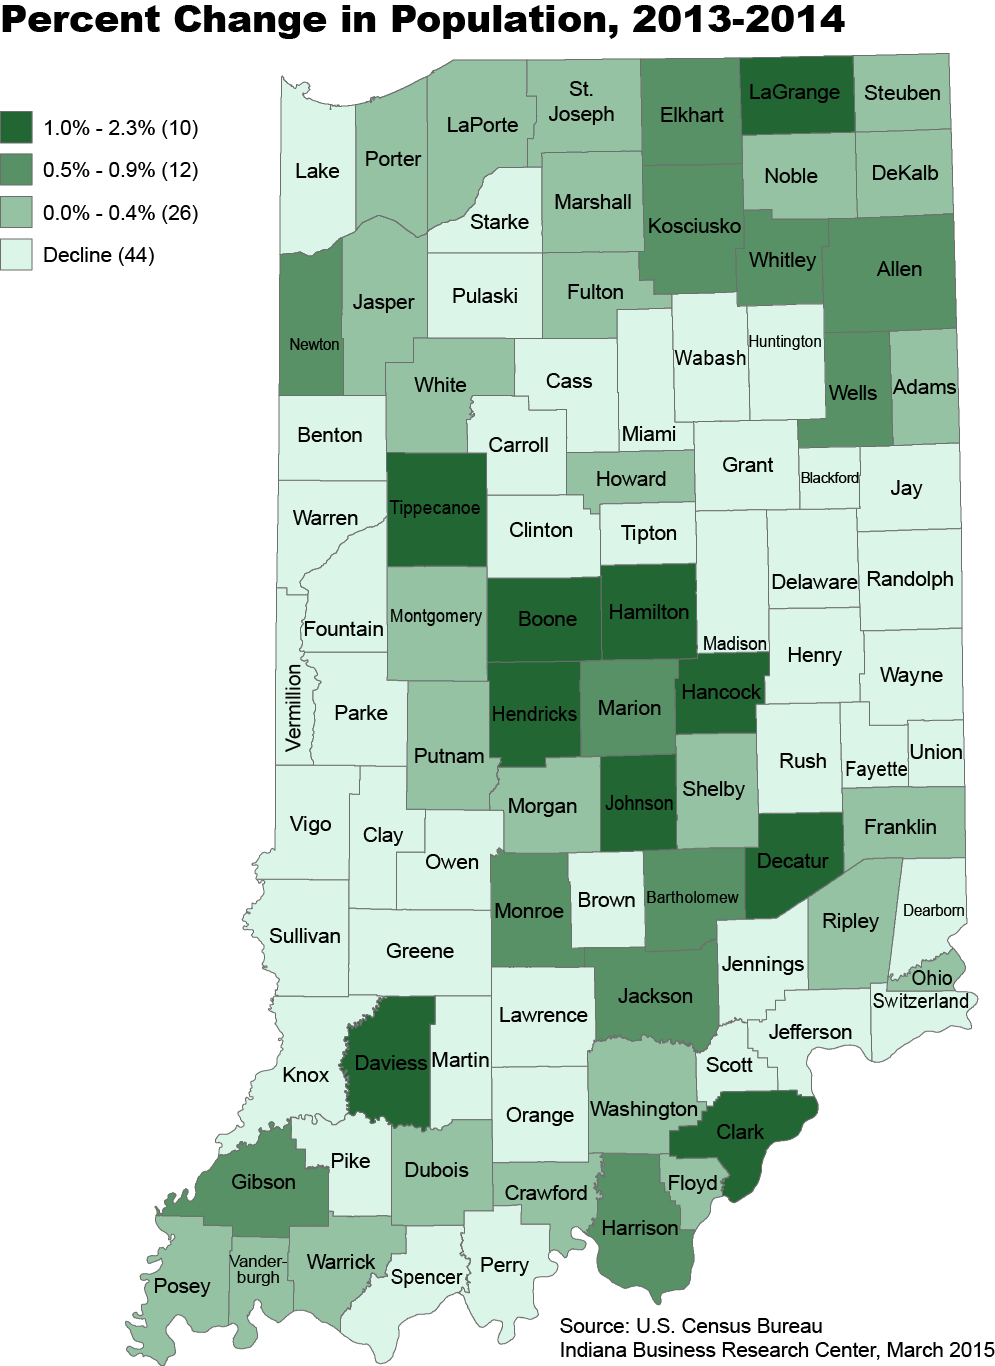
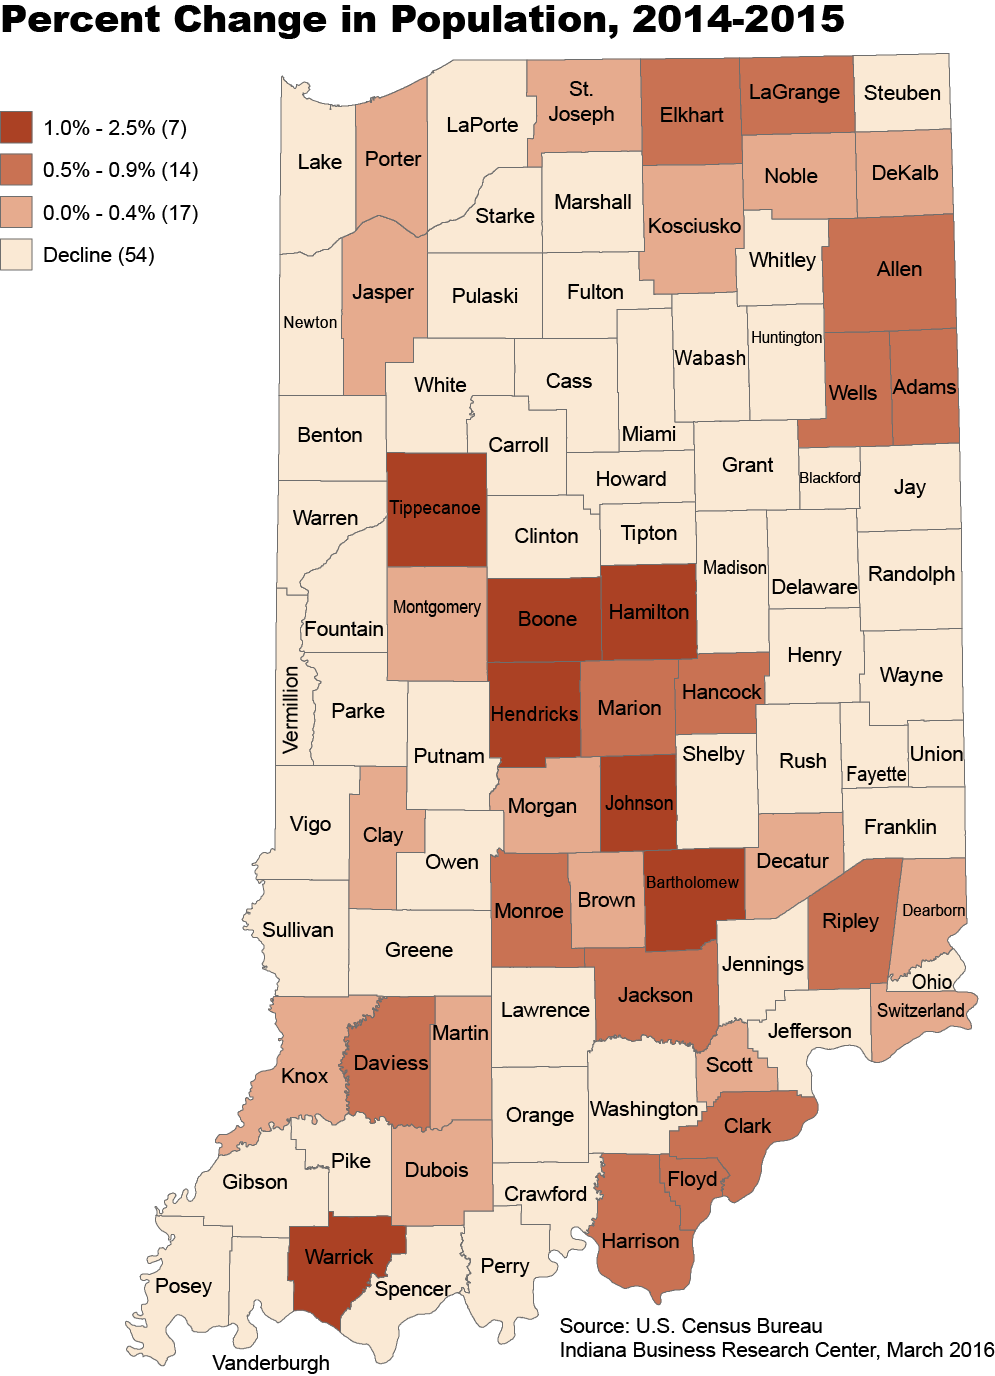
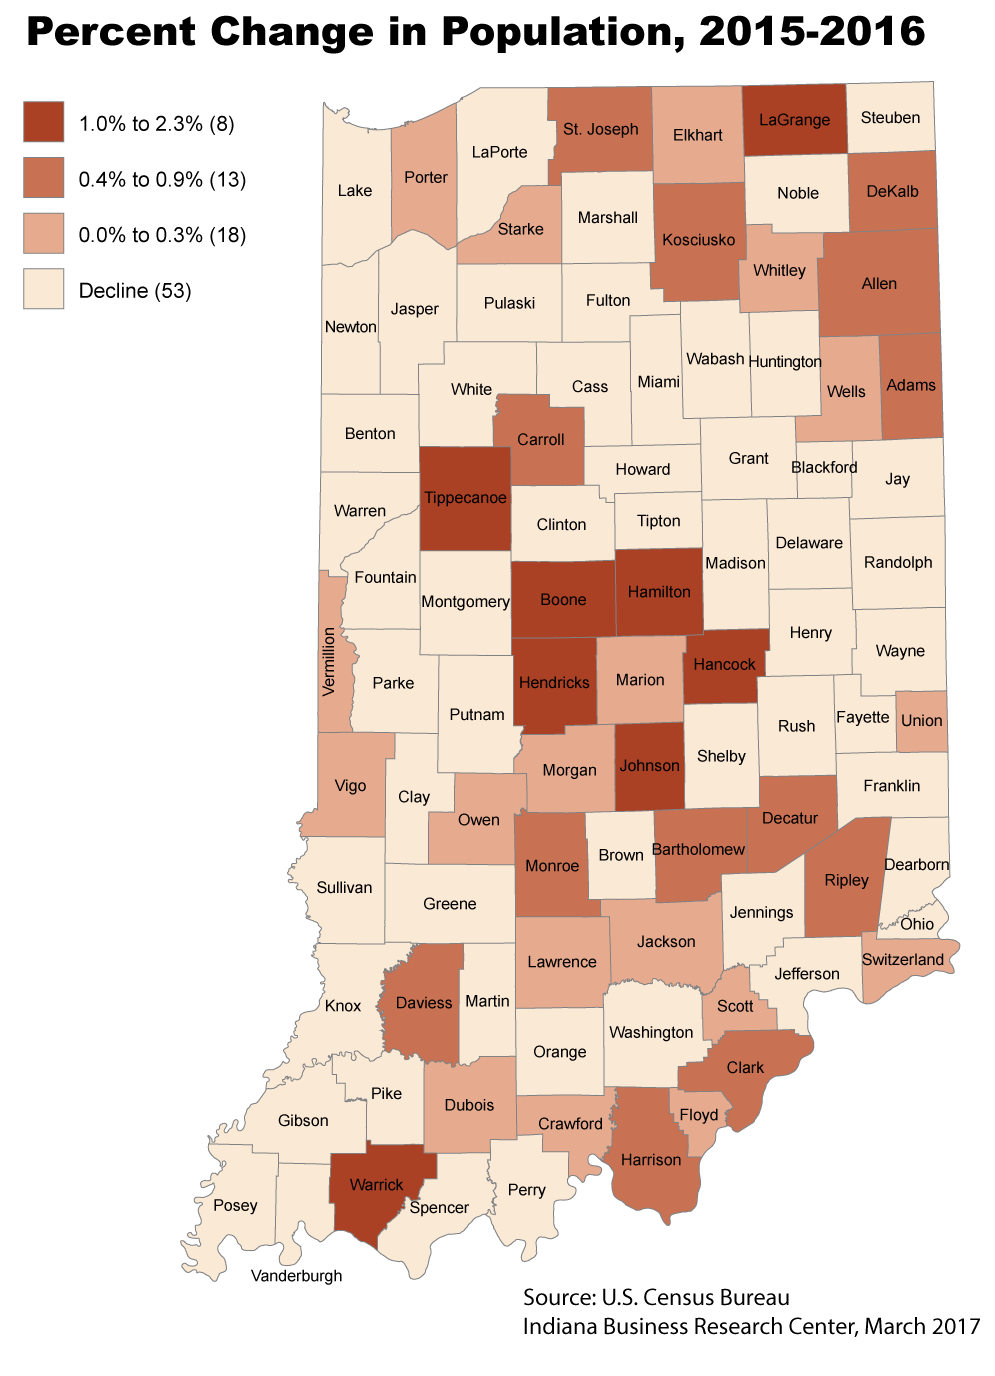
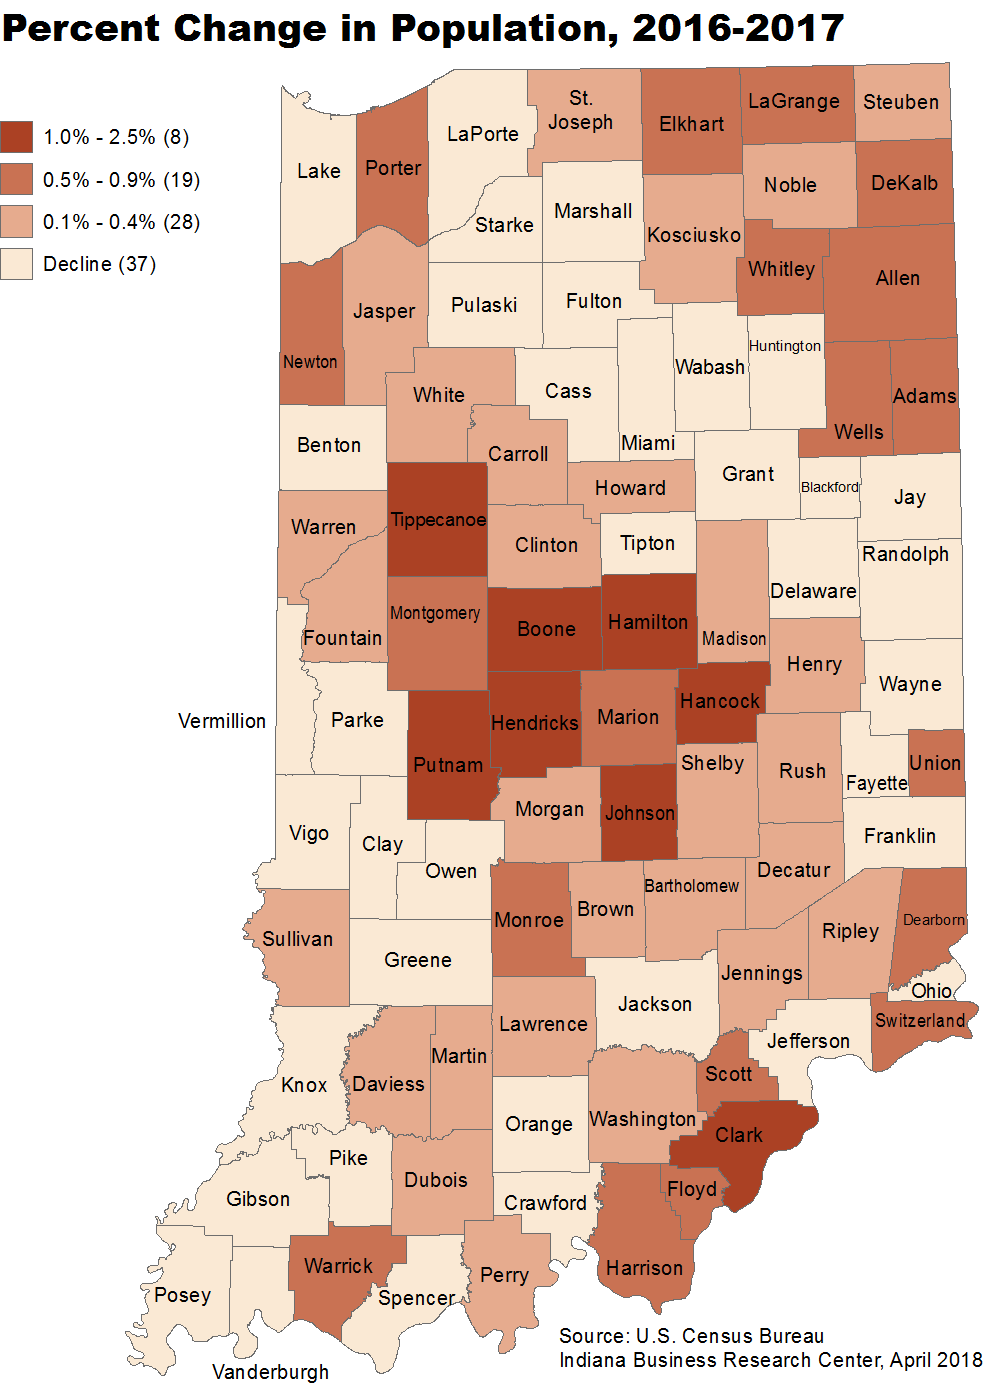
- Percent Population Change
Census 2010
Census 2000
- Total Population: 2000
- Population Percent Change
- 1990-2000
- 1990-2000 Relative to U.S.
- 1960-2000
- 1970-2000
- Population Density: 2000: U.S. Counties: GIF or PDF
- Population Density for 1990 and Percent Change: 1990-2000: U.S. Counties
- Population Distribution: 2000: U.S. Counties
- Difference in Number of People: 1990-2000: U.S. Counties
- Rural-Urban Areas: 2000
- Daytime Population: 2000: Counties
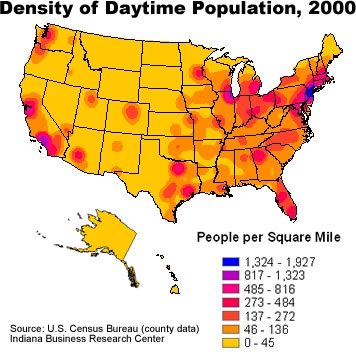
- Density of Daytime Population: 2000: U.S. Counties
By Age
- Under 18: 2000
- Under 18 Percent Change: 1990-2000: U.S. Counties
- School Age (5-17): 2000
- School Age Percent Change: 1990-2000
- Age 18-64: 2000: Tracts
- Age 65 and Over: 2000
- Age 65 and Over Density: 2000: U.S. Counties
Voting Age Population
- Number of Eligible Voters: Counties: 2000
- Eligible Black Voters as a Percent of Total: States -- 2000
- Eligible Hispanic Voters as a Percent of Total: States -- 2000
- Hispanic Citizens as a Percent of All Hispanics: States -- 2000
Median Age
- Median Age: 1970
- Median Age: 1980
- Median Age: 1990
- Median Age: 2000
Language
- Poverty Estimates: States:
- Families in Poverty: 2000
- Individuals in Poverty: 2000
- Single Mothers in Poverty: 2000
- Adults Age 65 and Over in Poverty: 2000
- Children Under 5 in Poverty: 2000
- Minorities as a Percent of Total Population: 2010
- Percent Nonwhite: 2000: Regions
- Prevalence: 2000: U.S. Counties
- Minority Prevalence: 2000: U.S. Counties
- Diversity: 2000: U.S. Counties
- Difference in Diversity: 1990-2000: U.S. Counties
- Two or More Races: Percent: 2000: U.S. Counties
- Two or More Races: Percent Under 18: 2000: U.S. Counties
- Two or More Races: Number: 2000: U.S. Counties
White
- Percent Change White: 1990-2000: U.S. Counties
- Percent White: 2000 -- Regions or U.S. Counties
- Percent White Under 18: 2000: U.S. Counties
- Number White: 2000: U.S. Counties
- Percent White Indicating One Race: 2000: U.S. Counties
- Percent Change: One or More Races Including White: 1990-2000: U.S. Counties
- Percent: One or More Races Including White: 2000: U.S. Counties
- Percent Under 18: One or More Races Including White: 2000: U.S. Counties
- Number: One or More Races Including White: 2000: U.S. Counties
White, Not Hispanic
- Percent Change White, Not Hispanic: 1990-2000: U.S. Counties
- Percent White, Not Hispanic: 2000: U.S. Counties
- Percent White, Not Hispanic Under 18: 2000: U.S. Counties
- Number White, Not Hispanic: 2000: U.S. Counties
- Percent White, Not Hispanic Indicating One Race: 2000: U.S. Counties
- Percent Change: One or More Races: 1990-2000: U.S. Counties
- Percent: One or More Races Including White, Not Hispanic: 2000: U.S. Counties
- Percent Under 18: One or More Races: 2000: U.S. Counties
- Number: One or More Races Including White, Not Hispanic: 2000: U.S. Counties
Black
- Percent Black: 2000 -- Tracts or Townships or U.S. Counties
- Percent Change Black: 1990-2000: U.S. Counties
- Percent Black Under 18: 2000: U.S. Counties
- Number Black: 2000: U.S. Counties
- Percent Black Indicating One Race: 2000: U.S. Counties
- Percent Change: One or More Races Including Black: 1990-2000: U.S. Counties
- Percent: One or More Races Including Black: 2000: U.S. Counties
- Percent Under 18: One or More Races Including Black: 2000: U.S. Counties
- Number: One or More Races Including Black: 2000: U.S. Counties
- Eligible Black Voters as a Percent of Total: States -- 2000
Hispanic
- Hispanic Population: 2010
- Percent Change in Hispanic Population: 2000-2010
- Percent Hispanic: 2000 -- Tracts or U.S. Counties
- Hispanic Numeric Change: 1990-2000 -- Counties or Townships
- Percent Change Hispanic: 1990-2000 -- Counties or Townships or U.S. Counties
- Percent Hispanic Under 18: 2000: U.S. Counties
- Number Hispanic: 2000: U.S. Counties
- Eligible Hispanic Voters as a Percent of Total: States: 2000
- Hispanic Citizens as a Percent of All Hispanics: States: 2000
Asian
- Percent Asian: 2000: Townships or U.S. Counties
- Asian Percent Change: 1990-2000: County or U.S. Counties
- Percent Asian Under 18: 2000: U.S. Counties
- Number Asian: 2000: U.S. Counties
- Percent Asian Indicating One Race: 2000: U.S. Counties
- Percent Change: One or More Races Including Asian: 1990-2000: U.S. Counties
- Percent: One or More Races Including Asian: 2000: U.S. Counties
- Percent Under 18: One or More Races Including Asian: 2000: U.S. Counties
- Number: One or More Races Including Asian: 2000: U.S. Counties
American Indian and Alaska Native (AIAN)
- Percent Change AIAN: 1990-2000: U.S. Counties
- Percent AIAN: 2000: U.S. Counties
- Percent AIAN Under 18: 2000: U.S. Counties
- Number AIAN: 2000: U.S. Counties
- Percent AIAN Indicating One Race: 2000: U.S. Counties
- Percent Change: One or More Races Including AIAN: 1990-2000: U.S. Counties
- Percent: One or More Races Including AIAN: 2000: U.S. Counties
- Percent Under 18: One or More Races Including AIAN: 2000: U.S. Counties
- Number: One or More Races Including AIAN: 2000: U.S. Counties
Native Hawaiian and Other Pacific Islander (NHOPI)
- Percent Change NHOPI: 1990-2000: U.S. Counties
- Percent NHOPI: 2000: U.S. Counties
- Percent NHOPI Under 18: 2000: U.S. Counties
- Number NHOPI: 2000: U.S. Counties
- Percent NHOPI Indicating One Race: 2000: U.S. Counties
- Percent Change: One or More Races Including NHOPI: 1990-2000: U.S. Counties
- Percent: One or More Races Including NHOPI: 2000: U.S. Counties
- Percent Under 18: One or More Races Including NHOPI: 2000: U.S. Counties
- Number: One or More Races Including NHOPI: 2000: U.S. Counties
- Rural-Urban Areas (as defined by the Census Bureau): 2000
- Counties in Metropolitan Areas: 1990-2000: U.S. Counties